Display Modes
Spectrum
The mode is intended for representation of the general view of the photon (gamma and X-ray) radiation energy spectrum.
In the Spectrum display mode the screen shows:
- state panel - from top;
- energy spectrum of photon (gamma and X-ray) radiation.
The upper part of the screen, from left to right, contains basic information about the instrument status:

- scale of the amplitude scale of the photon radiation energy spectrum - linear or logarithmic;
- time since the beginning of spectrum accumulation: hours, minutes, seconds;
- sign of exceeding thresholds by dose rate, dose rate, count rate;
- audio indication status;
- Bluetooth or USB connection;
- swing buttons lock sign;
- battery status.
At the bottom of the screen from left to right:
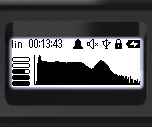
- graphical representation of dose rate estimation;
- histogram of the photon radiation energy spectrum.
Labels are placed under the energy scale of the histogram:
- dots - every 100keV;
- dashes every 500keV;
- arrows - every 1000keV.
Quick Control is available in this mode:
- a short press on the upper swing button switches the spectrum amplitude scale between linear and logarithmic;
- a short press on the lower button of the swing cycles the scale of the energy scale 1MeV -> 2MeV -> 3MeV -> 1MeV.... ;
- long press on the lower button of the swing clears the screen and starts a new session of spectrum accumulation;
- long pressing the upper button of the swing turns on and off the sound indication.
Using the buttons
Quick control of the spectrum view is available via the buttons:
- a short press on the upper swing button switches the spectrum amplitude scale between linear and logarithmic;
- a short press on the lower button of the swing cycles the scale of the energy scale 1MeV -> 2MeV -> 3MeV -> 1MeV.... ;
- long press on the lower button of the swing clears the screen and starts a new session of spectrum accumulation;
- long pressing the upper button of the swing turns on and off the sound indication.
Updated: Dec 12, 2025