Software
Radiacode devices are engineered for both autonomous operation and enhanced functionality when paired with a smartphone or computer.

Choose the one that suits you best
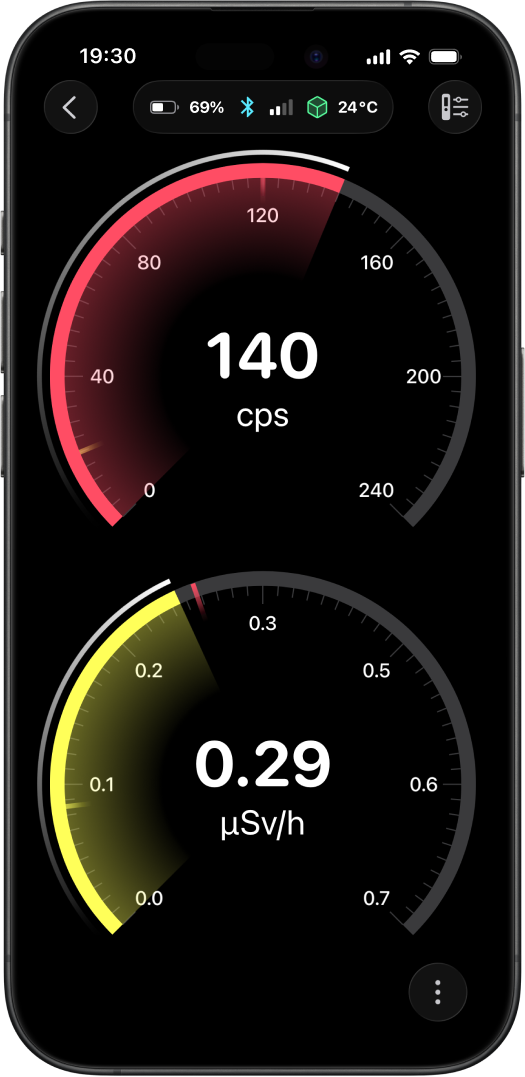
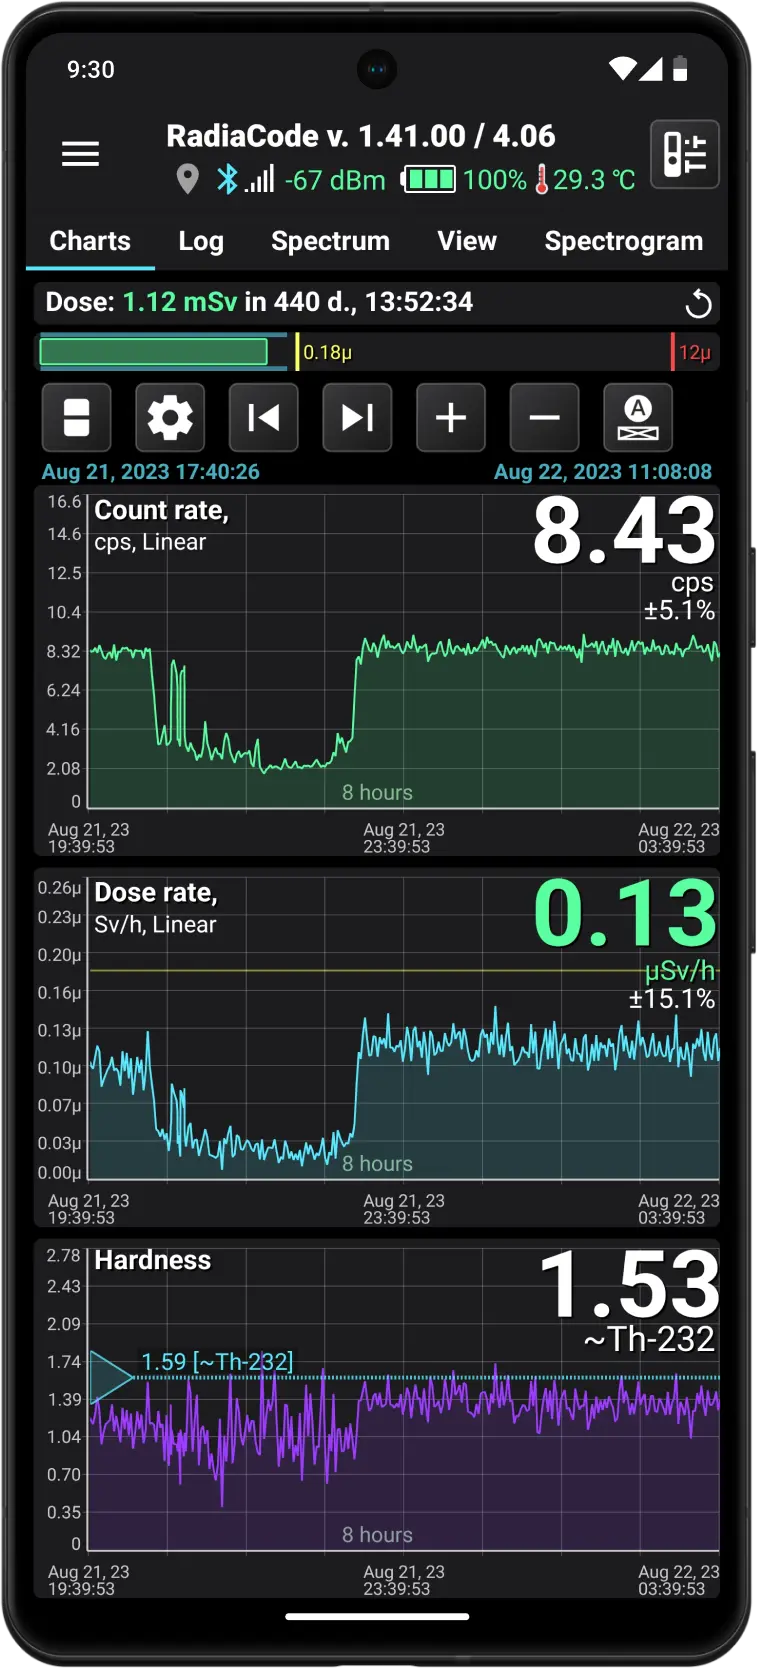
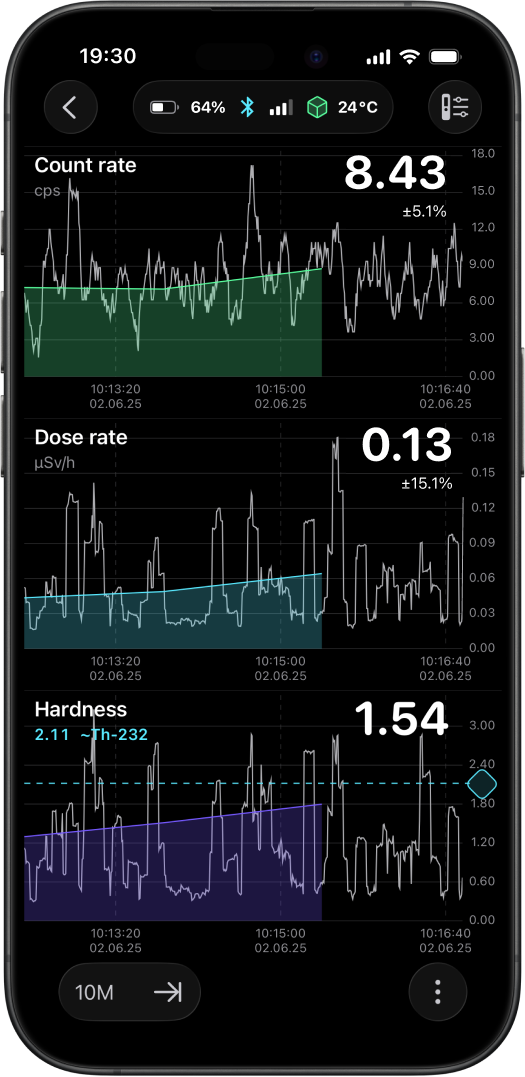
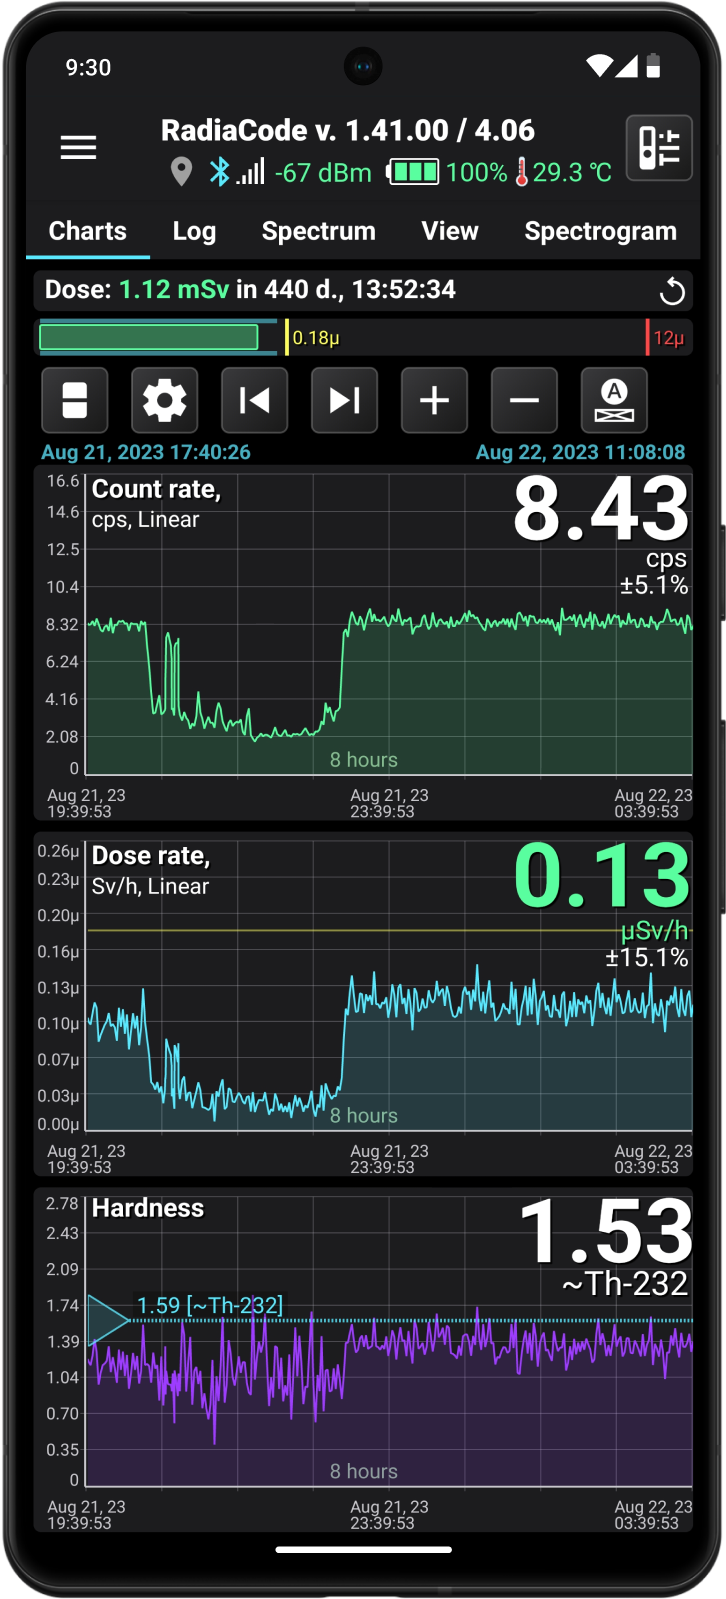
Charts
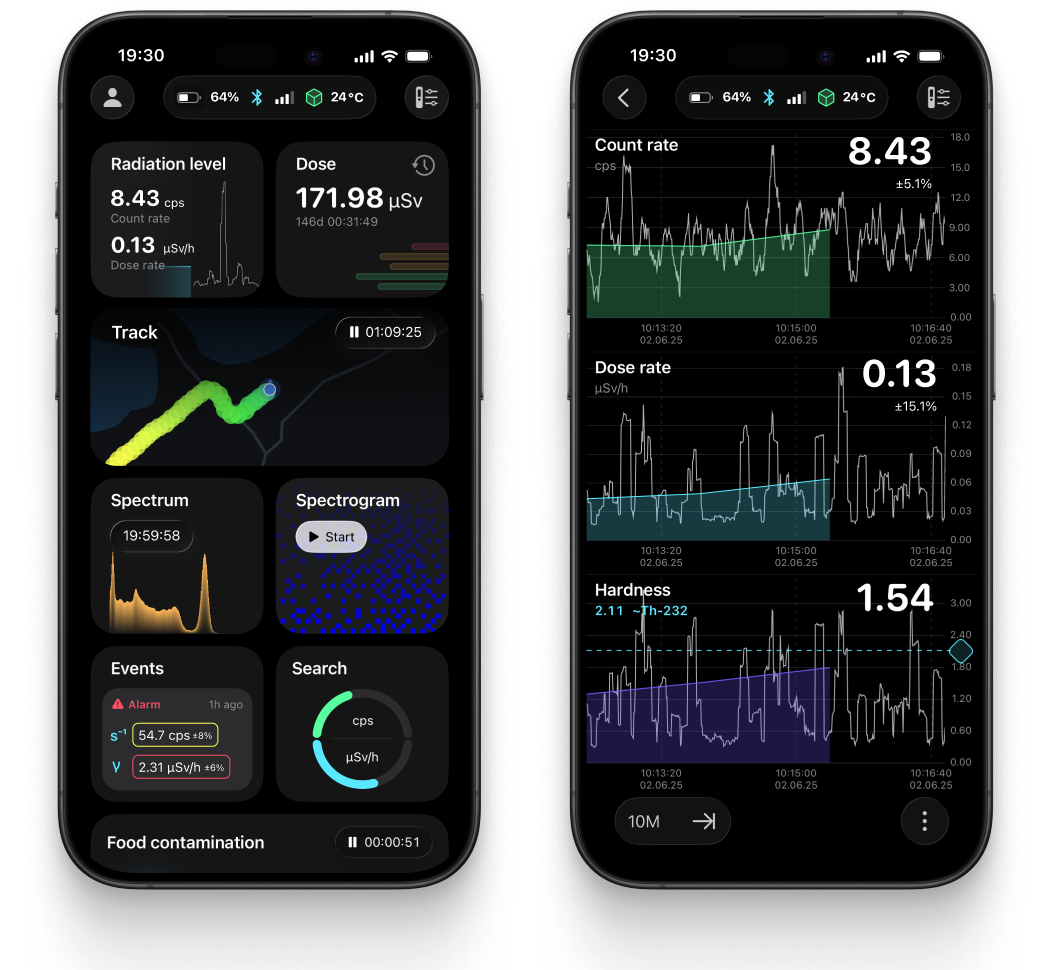
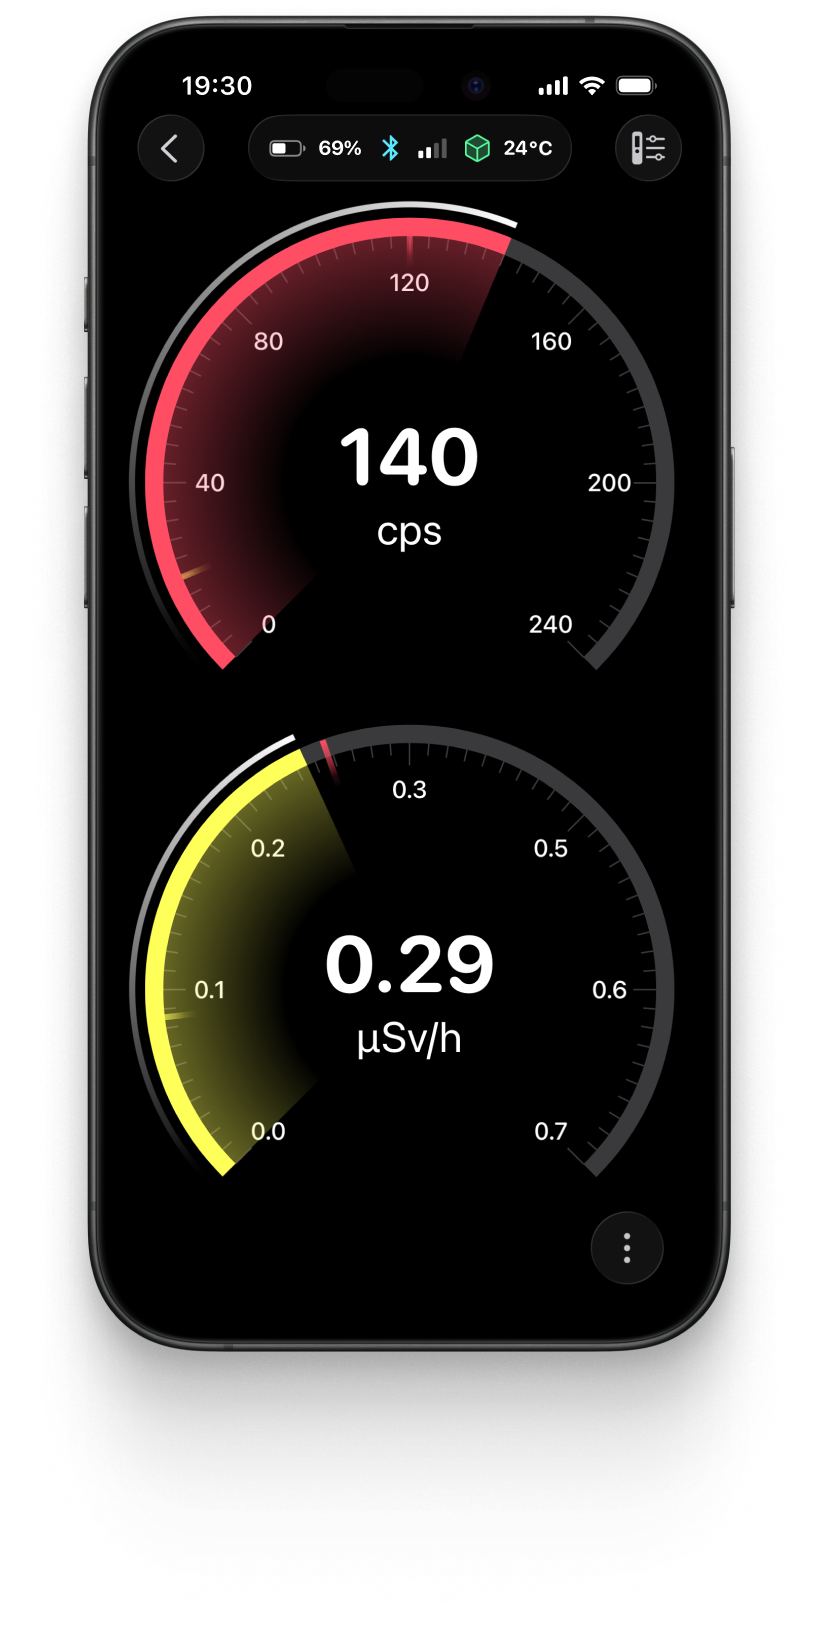
Radiacode mobile application features a real-time dashboard displaying key data, allowing you to monitor essential information at a glance. Dedicated section with interactive charts that track radiation levels over time, providing detailed analysis and insights for informed decision-making.
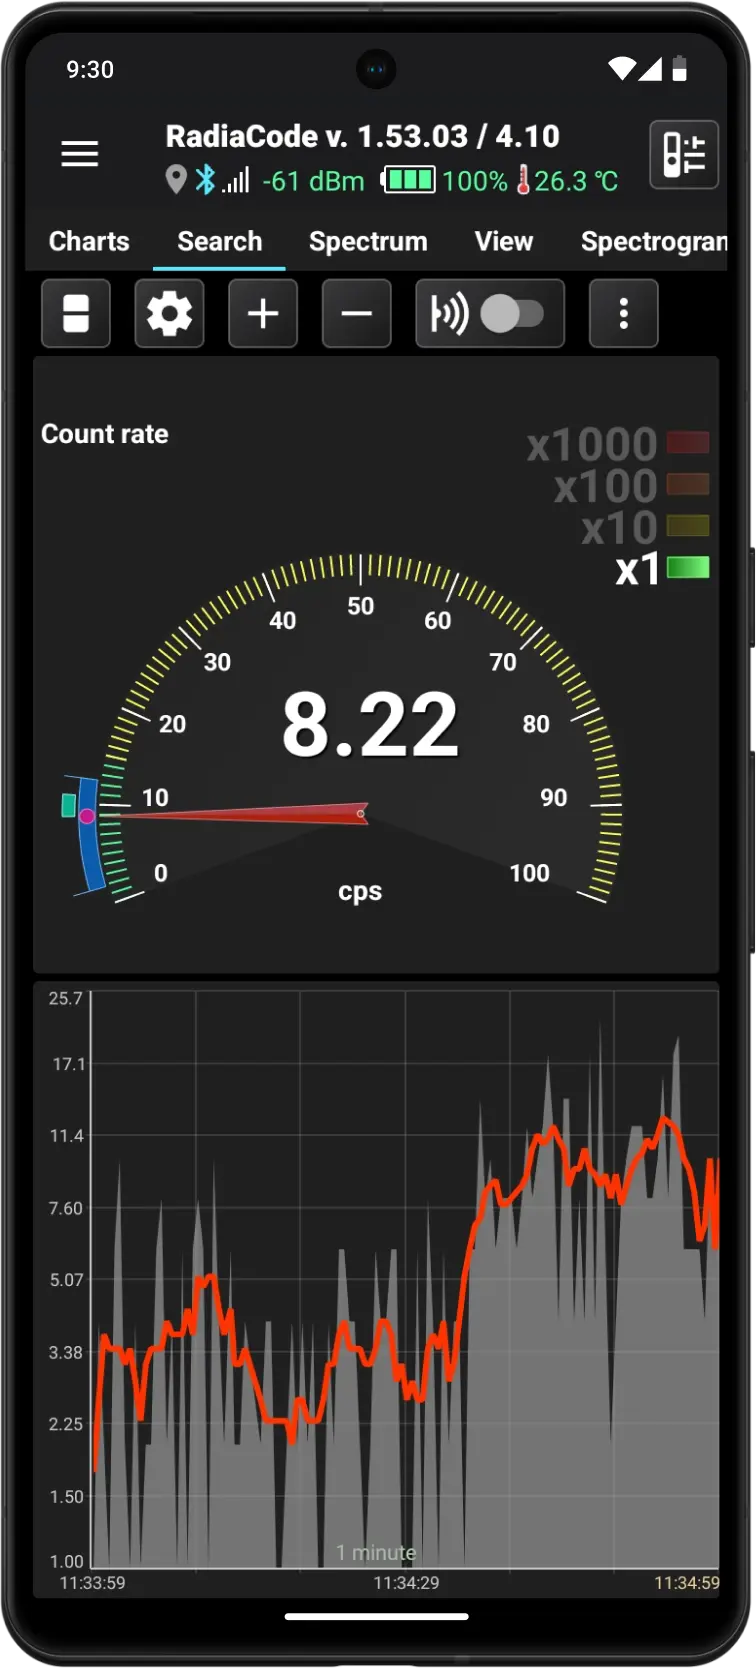
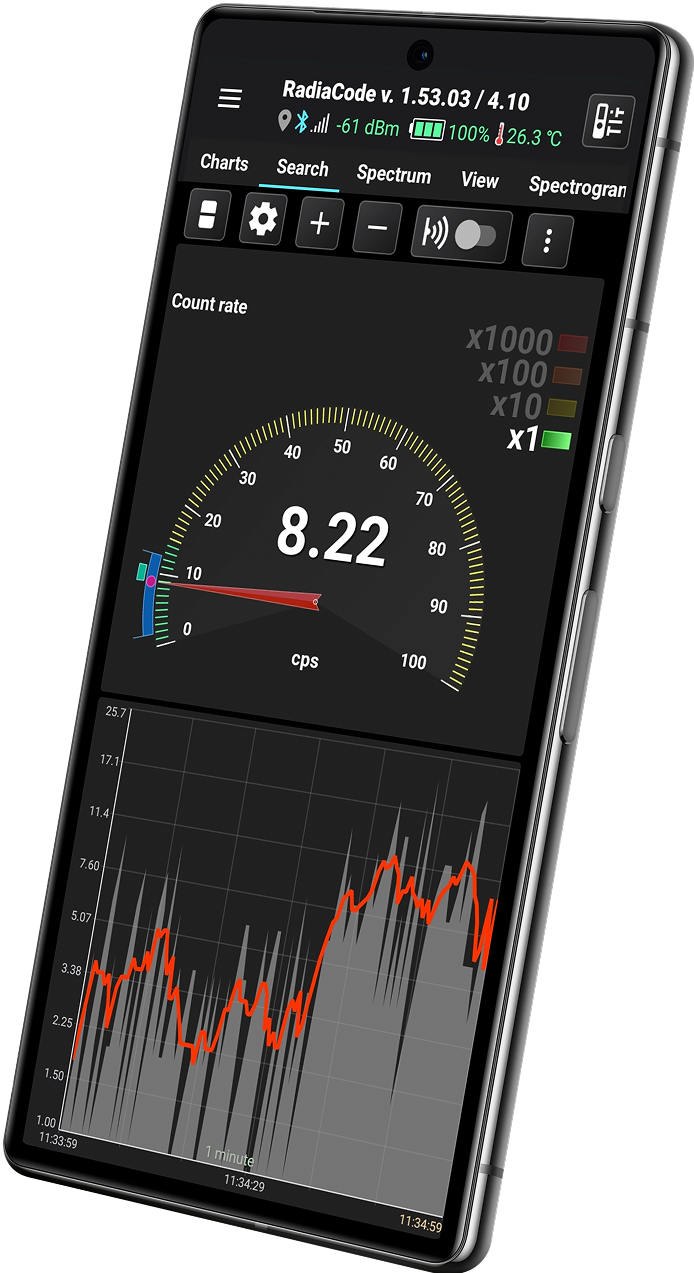
Search
This mode is specifically designed for detecting radiation sources and has an enhanced response to changes in background radiation. It also allows the sound of detected particles to be played directly through the phone's speaker.
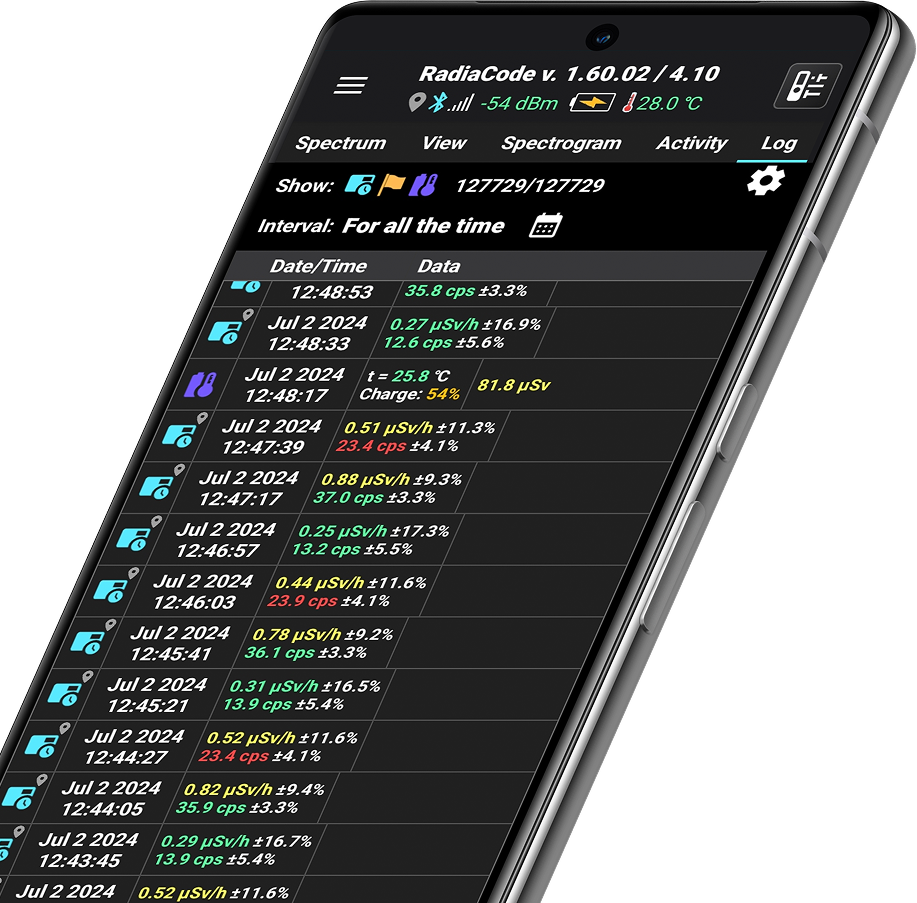
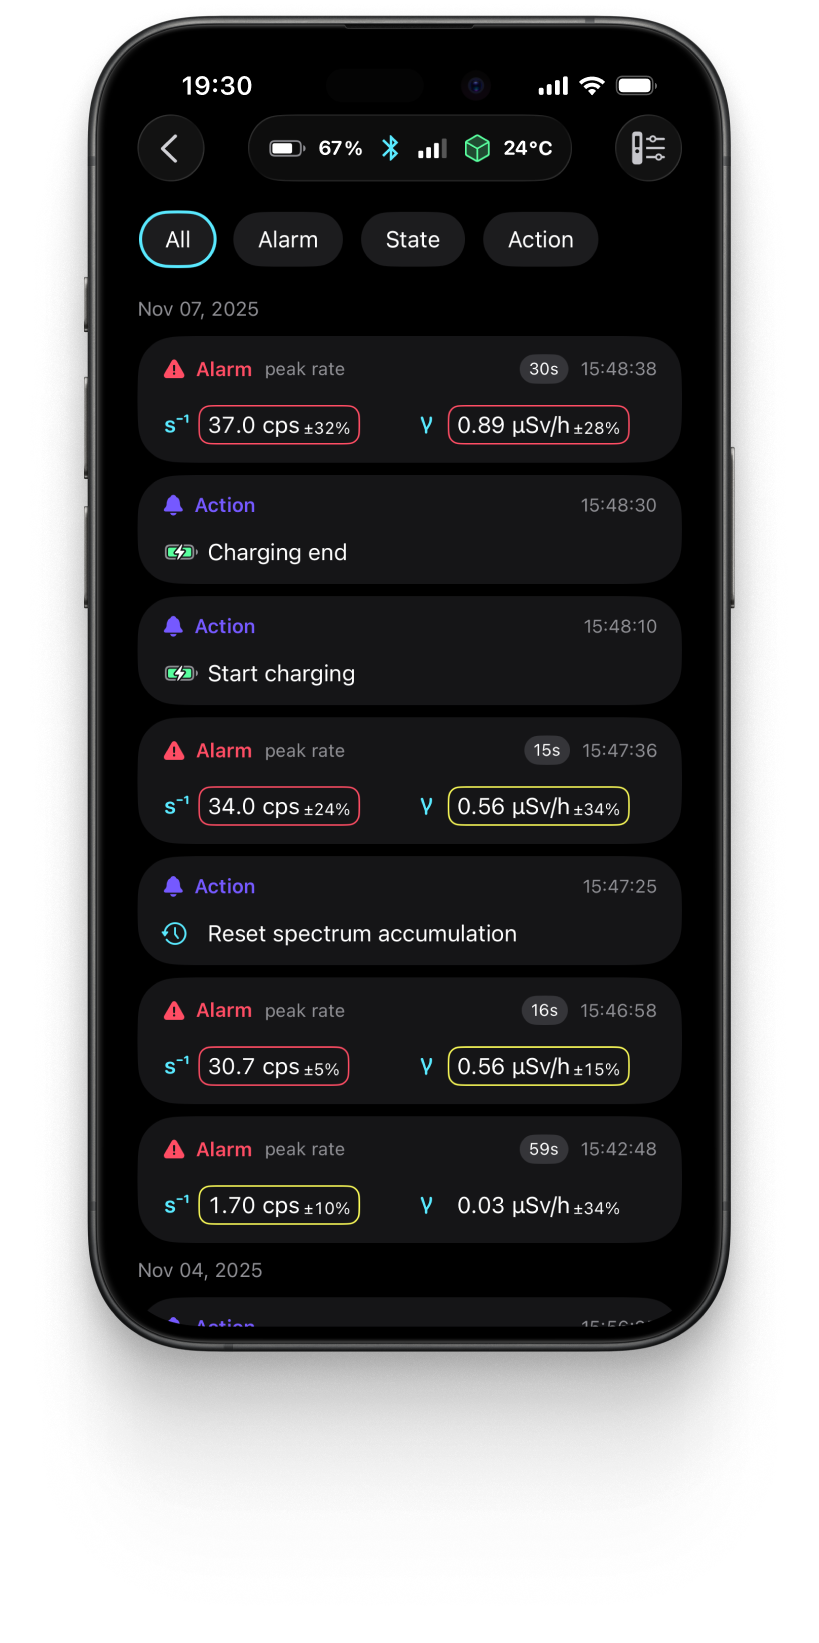
Events log
Track all events that happens with device keeping you informed about significant events and changes.
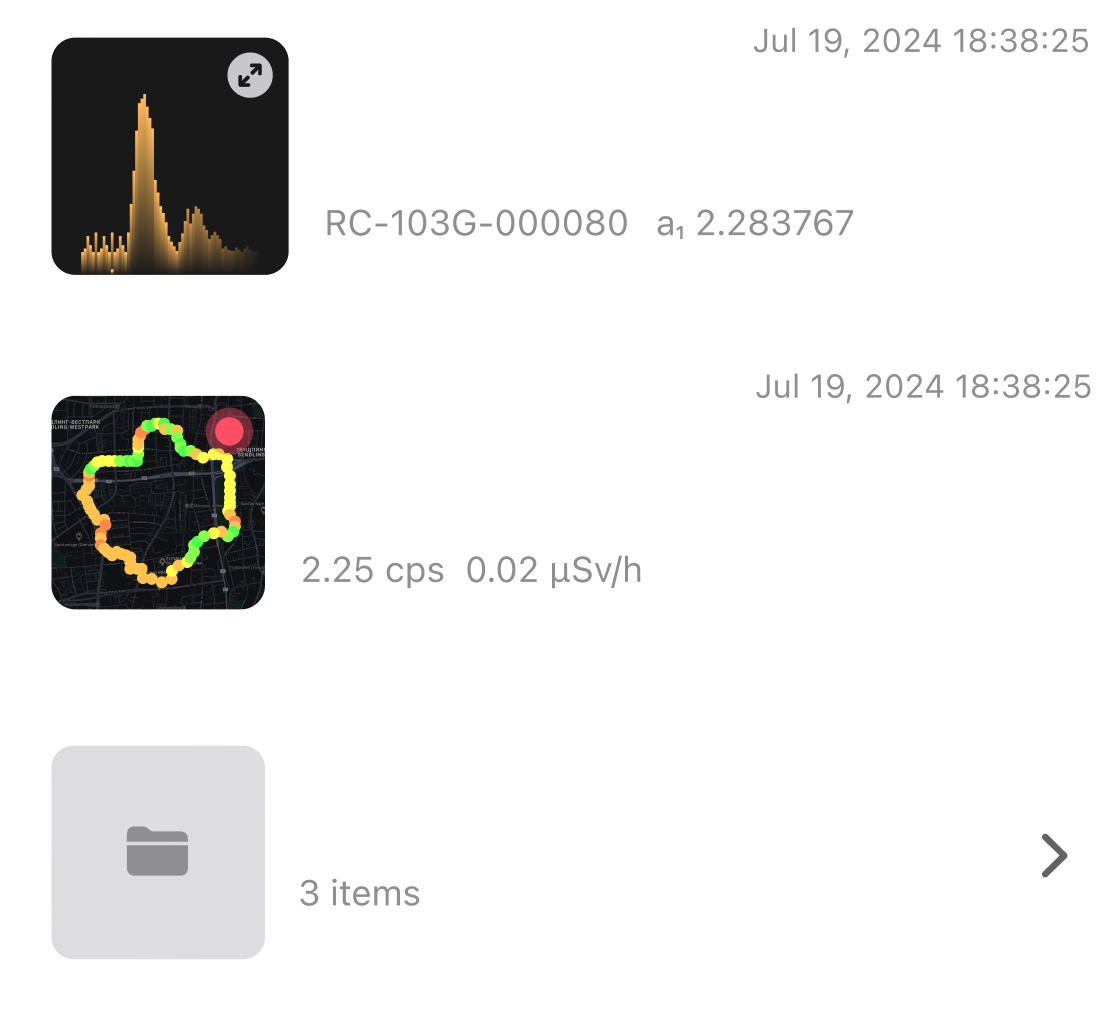
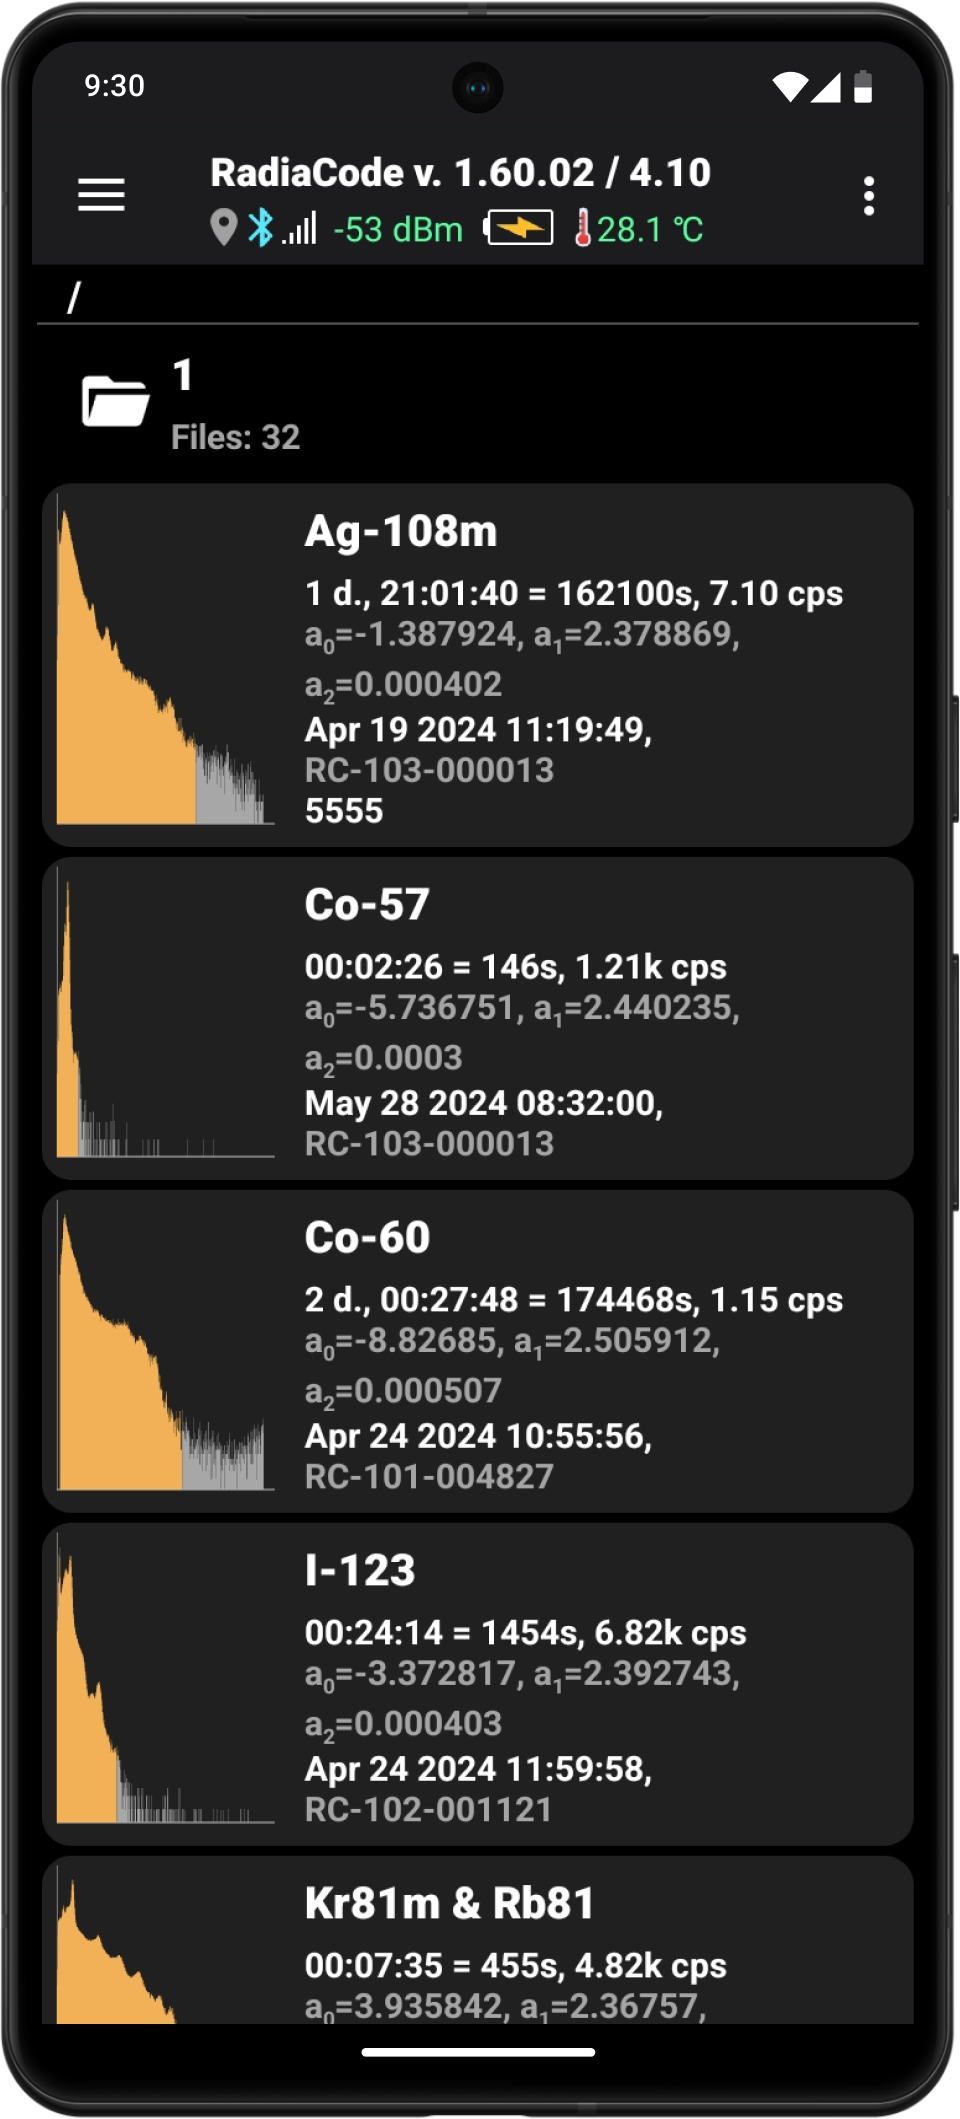
Library
Save your research tracks and spectrums, in dedicated libraries within our mobile application, ensuring easy organization and access to scientific data anytime, anywhere.
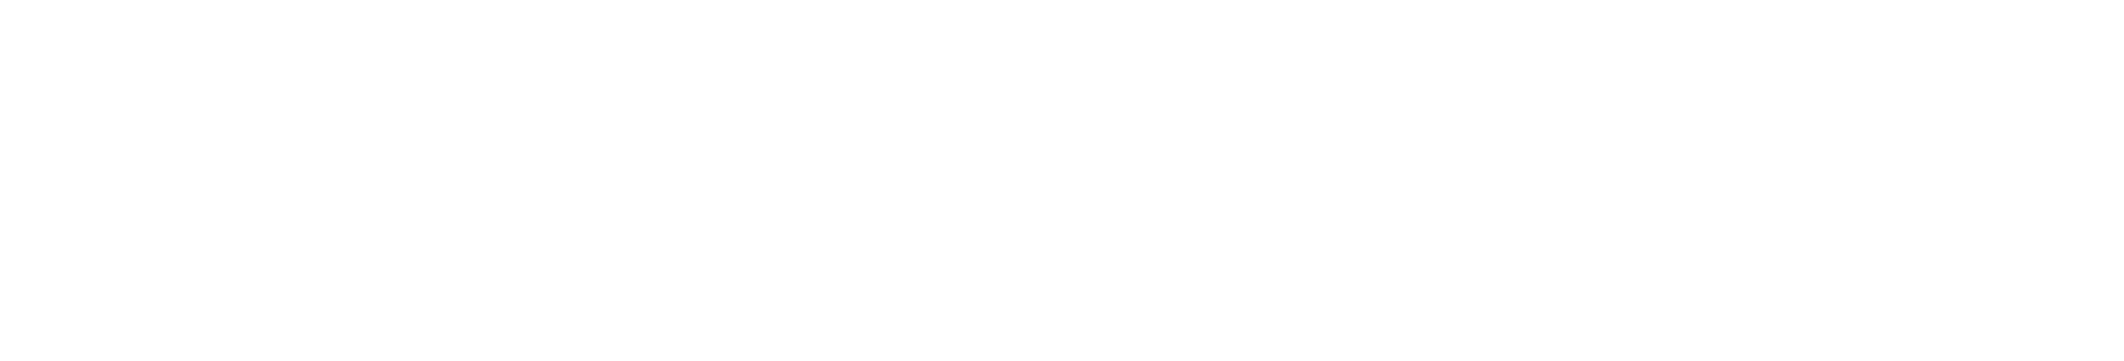
Isotope visualization
The isotope visualization capability in the Radiacode mobile app enables new avenues for amateur scientific research.
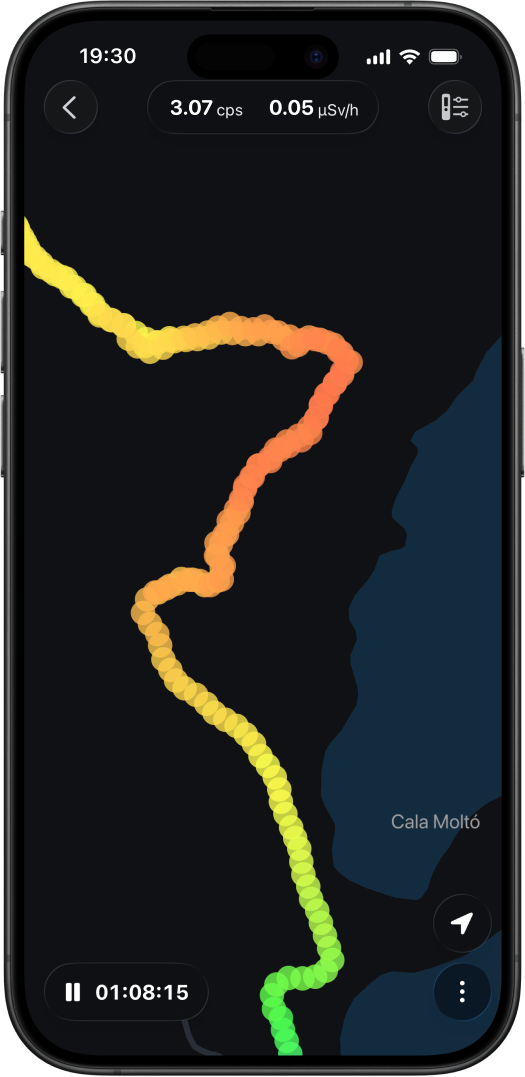
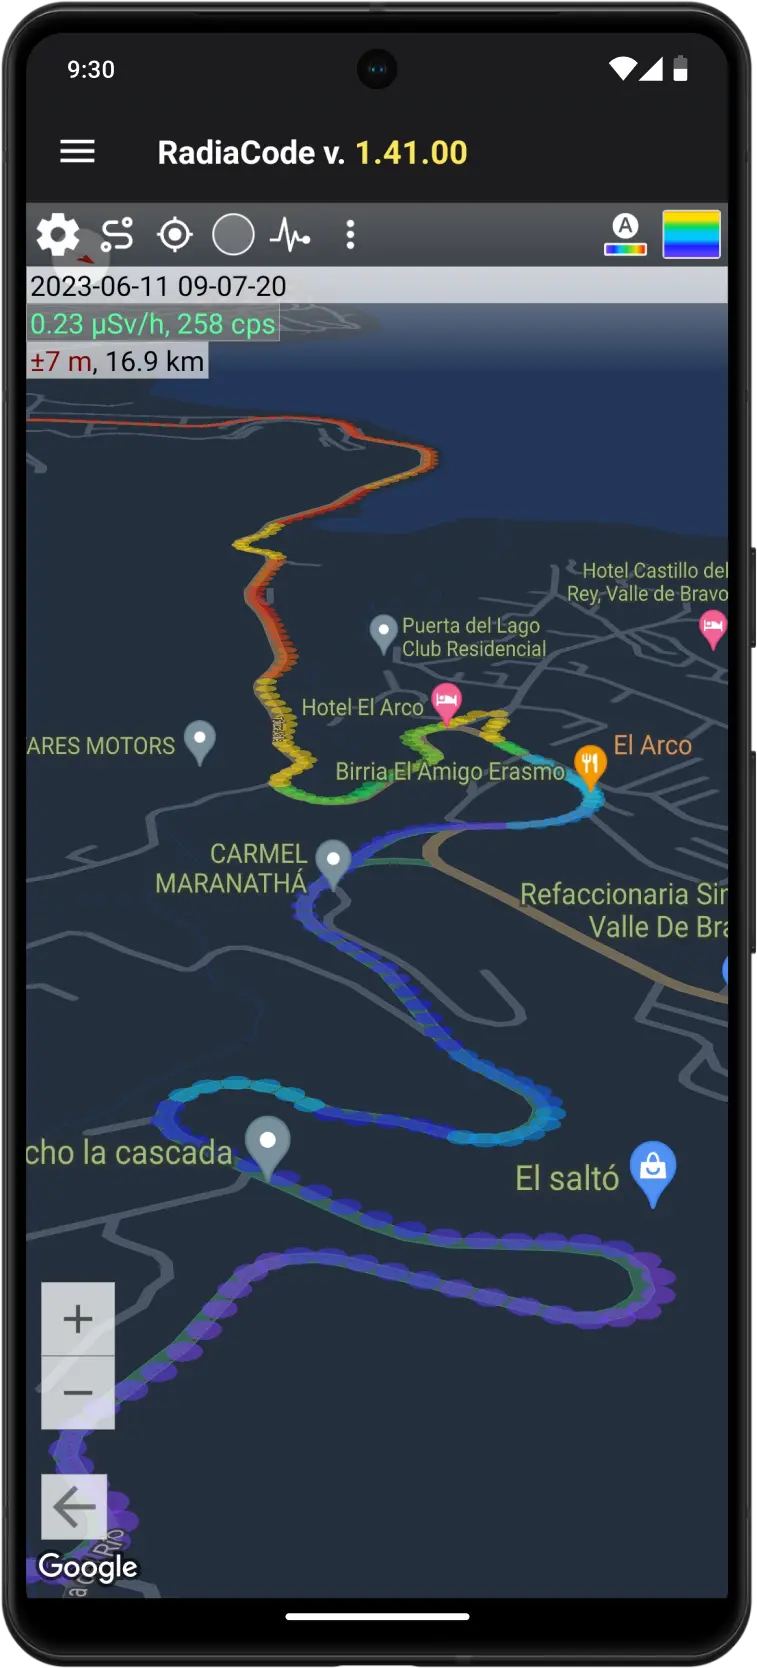
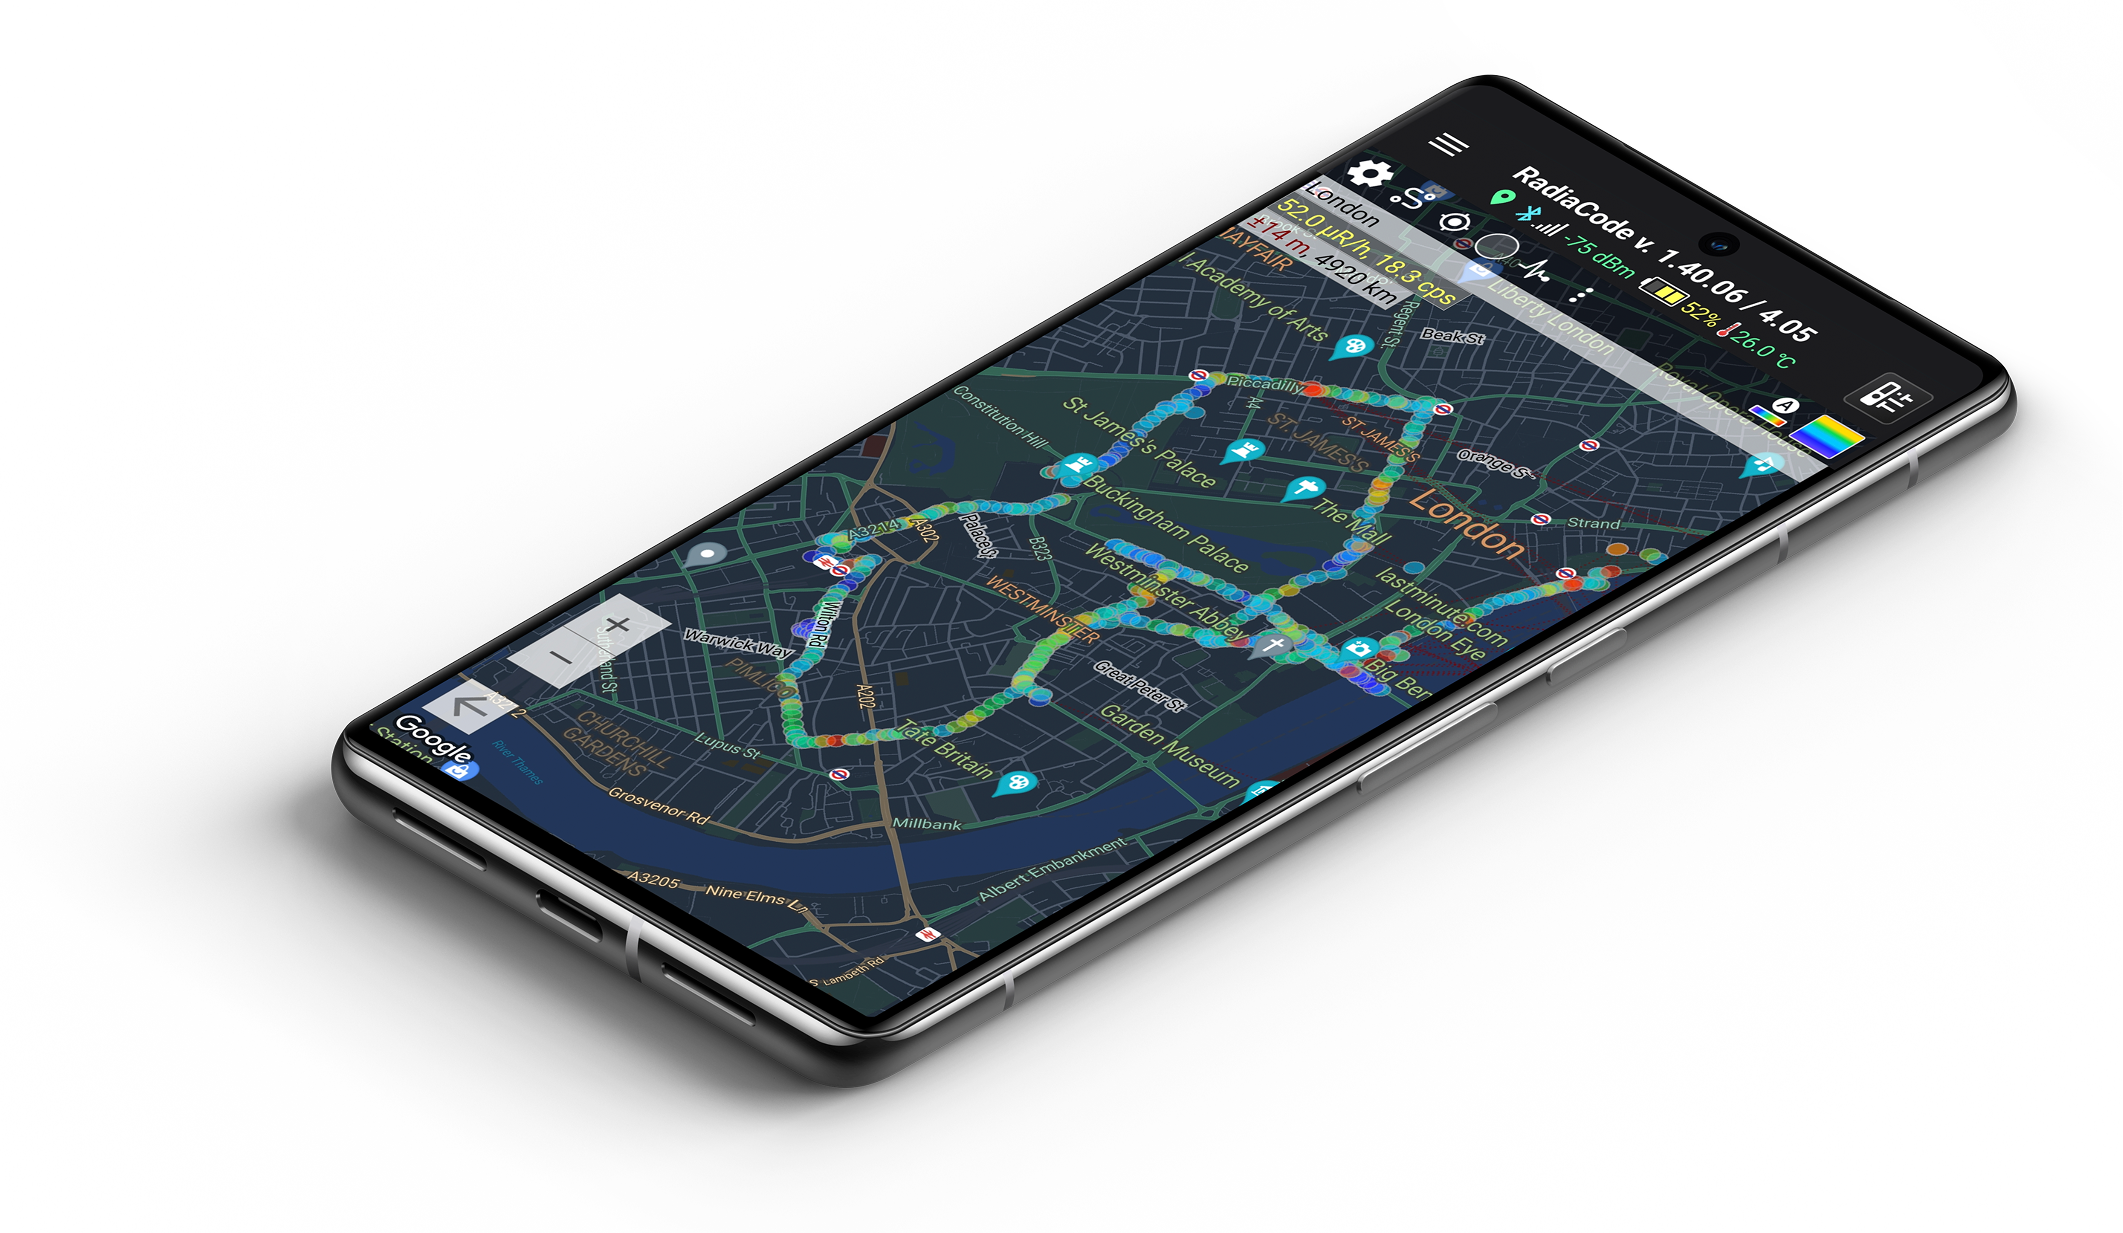
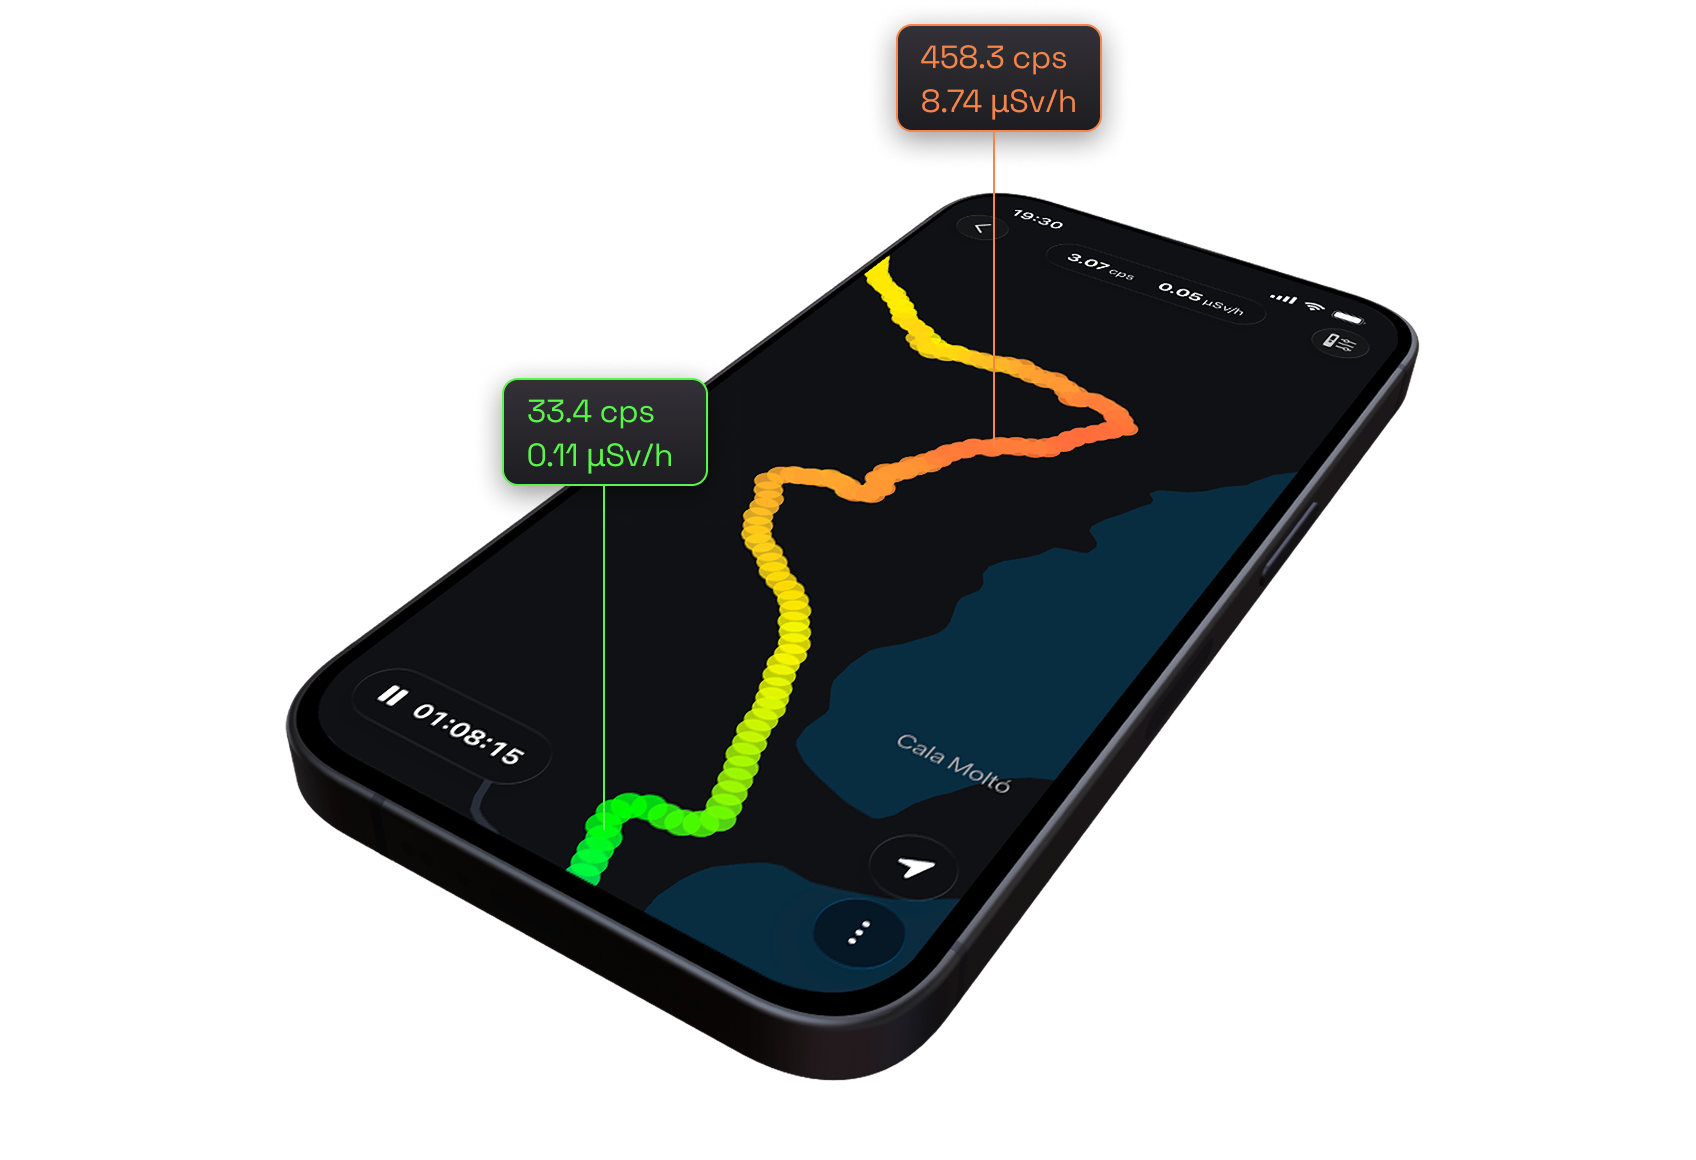
Radiation mapping
The Radiation Mapping function in Radiacode records radiation measurements on Google Maps, creating a color-coded track that indicates radiation level.
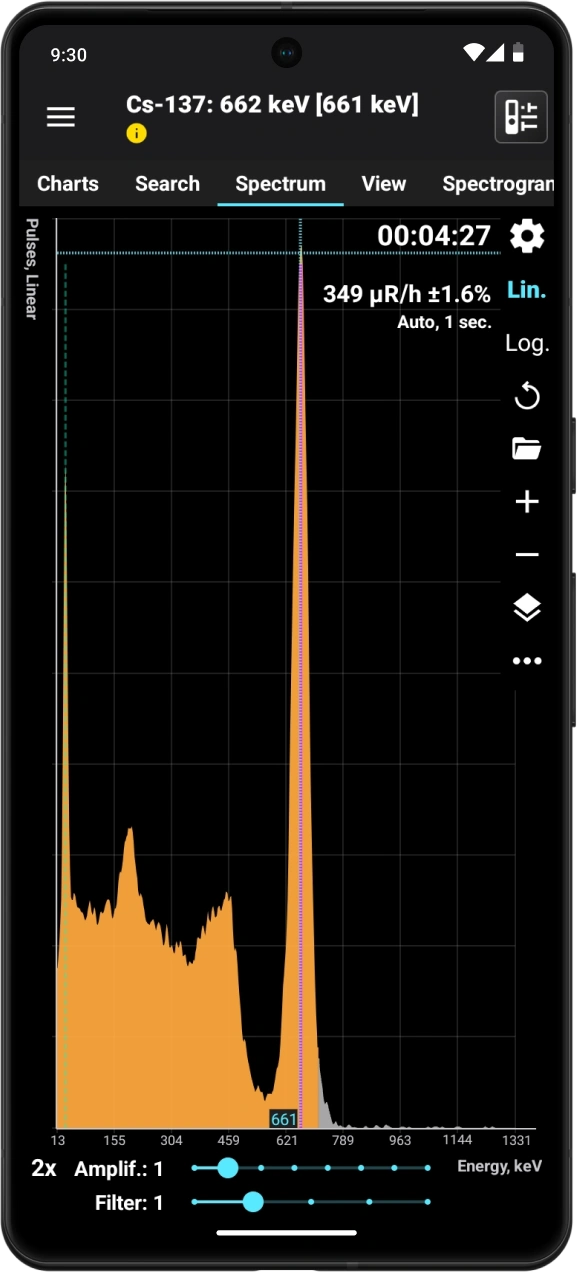
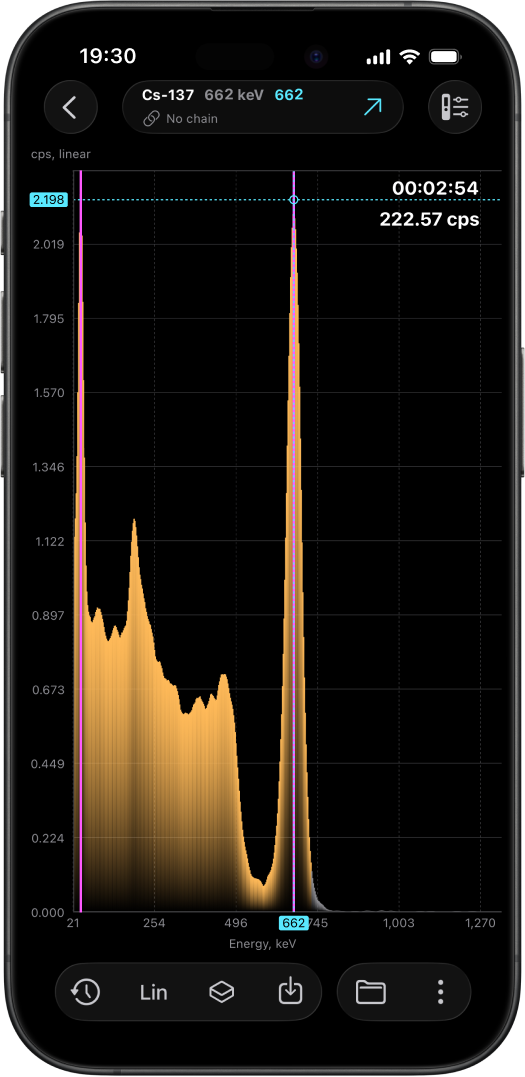
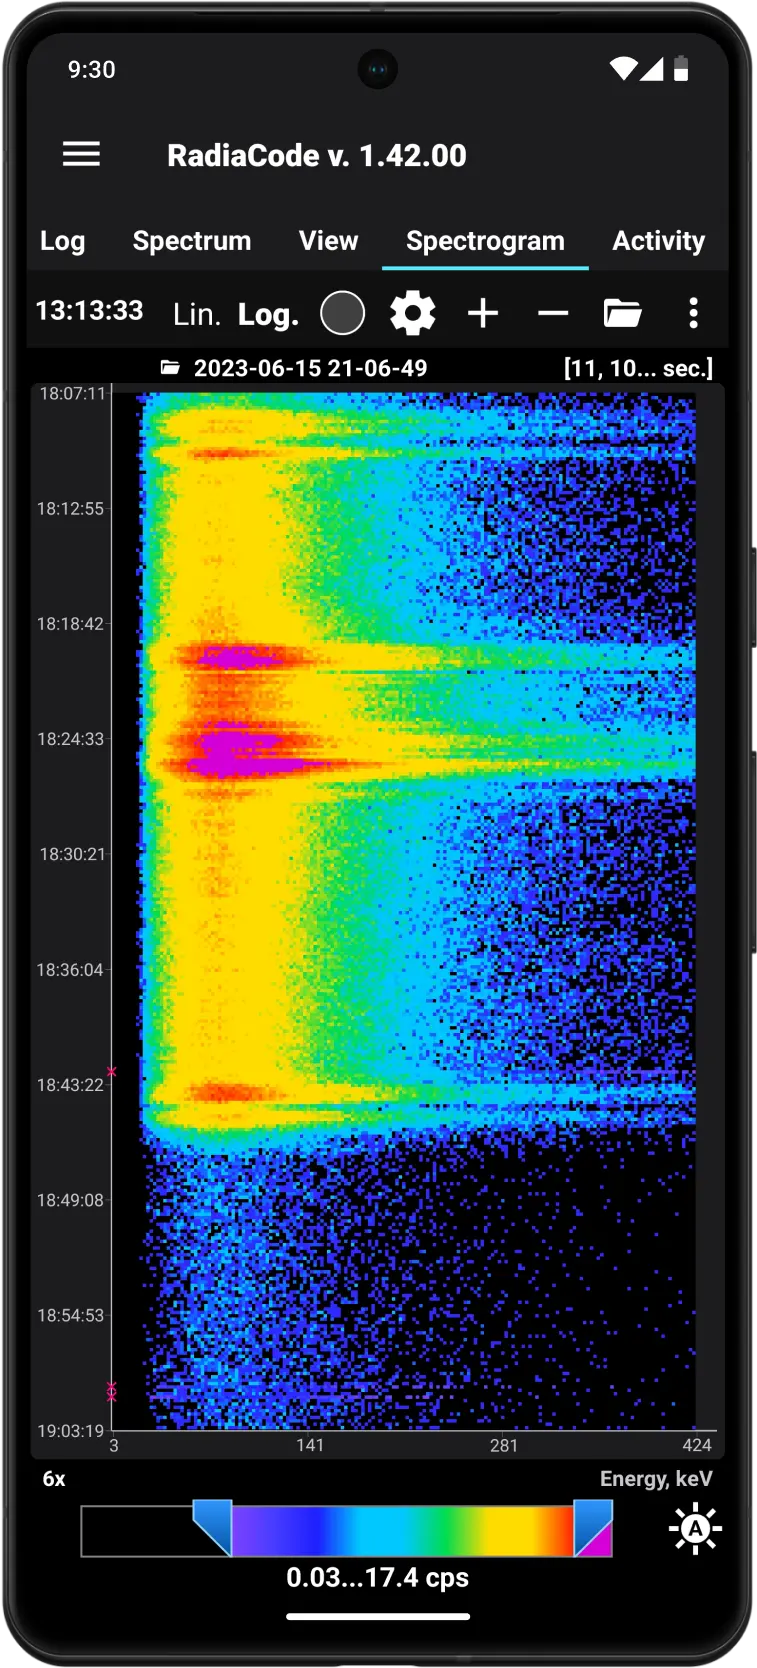
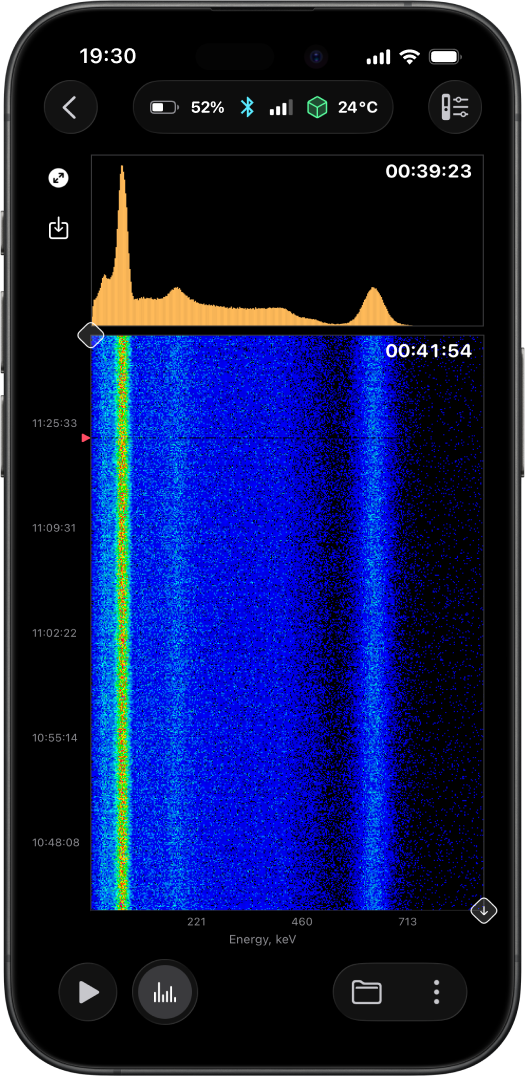
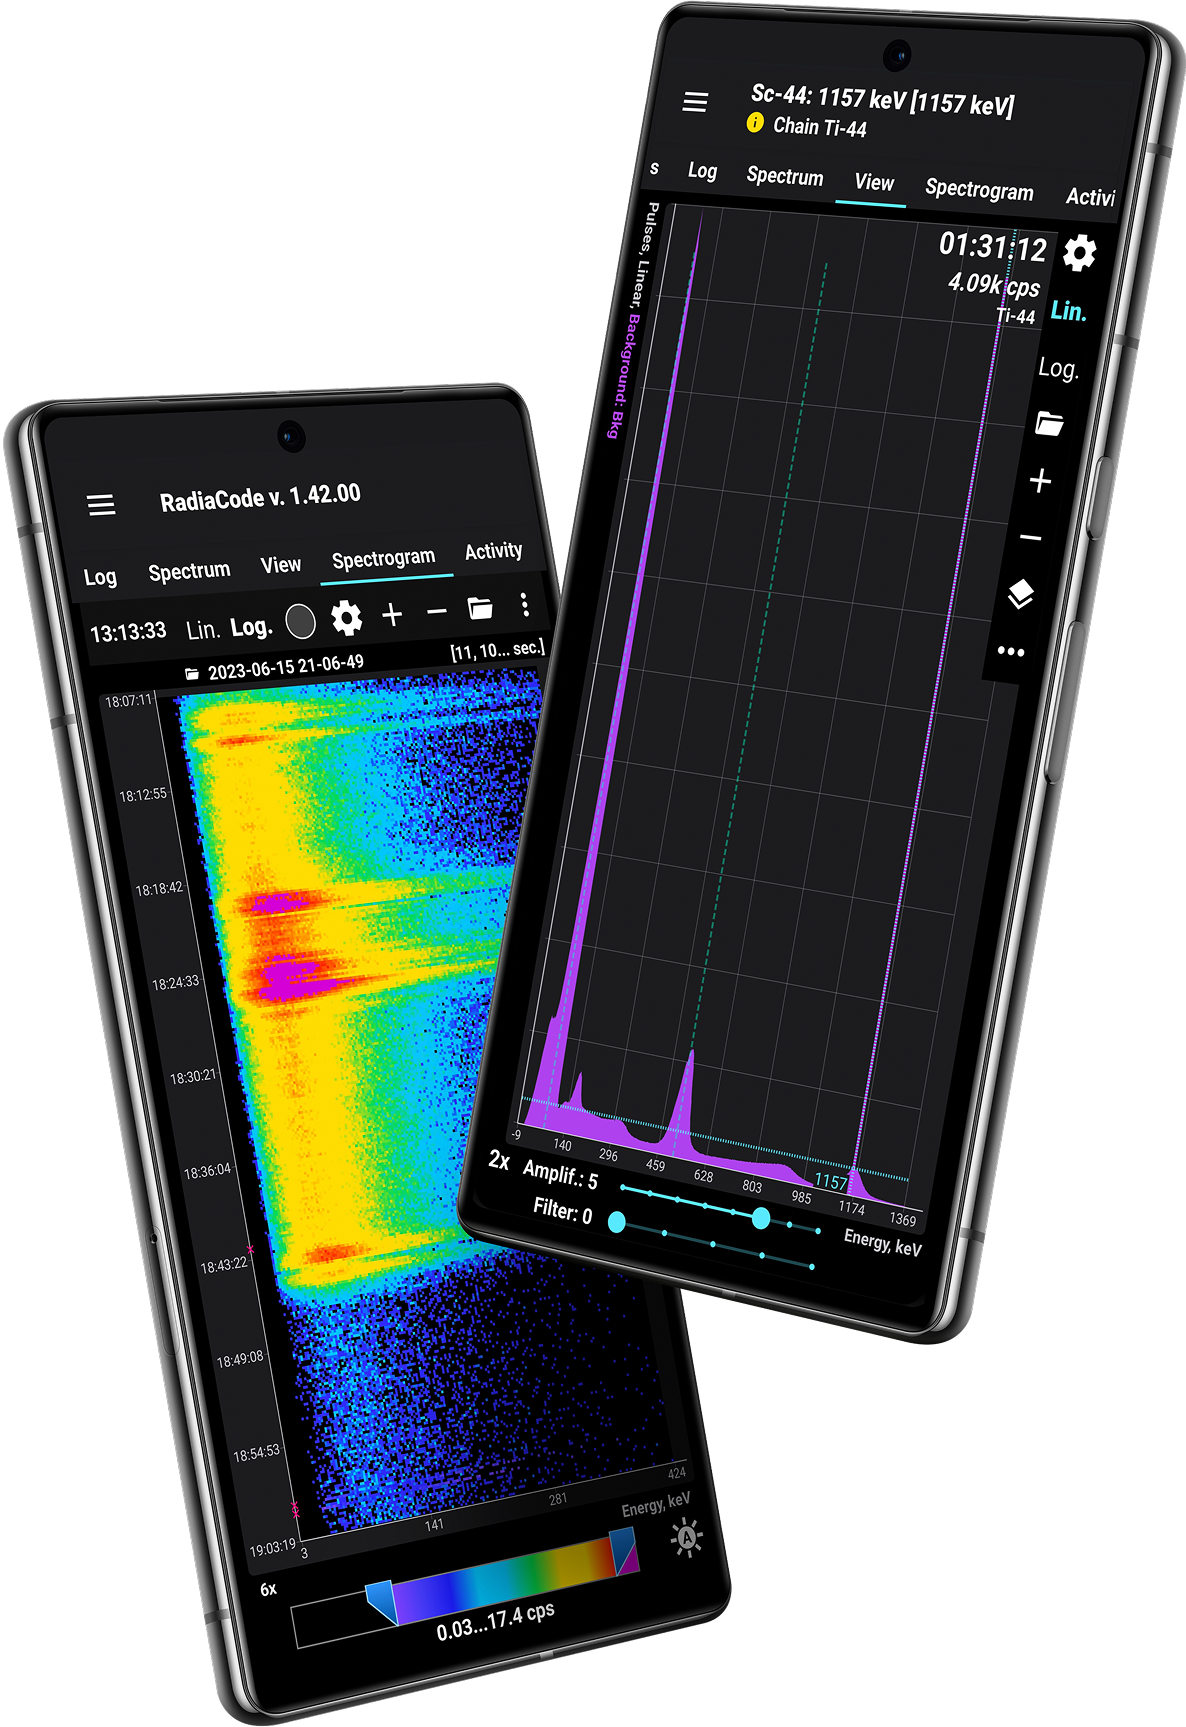
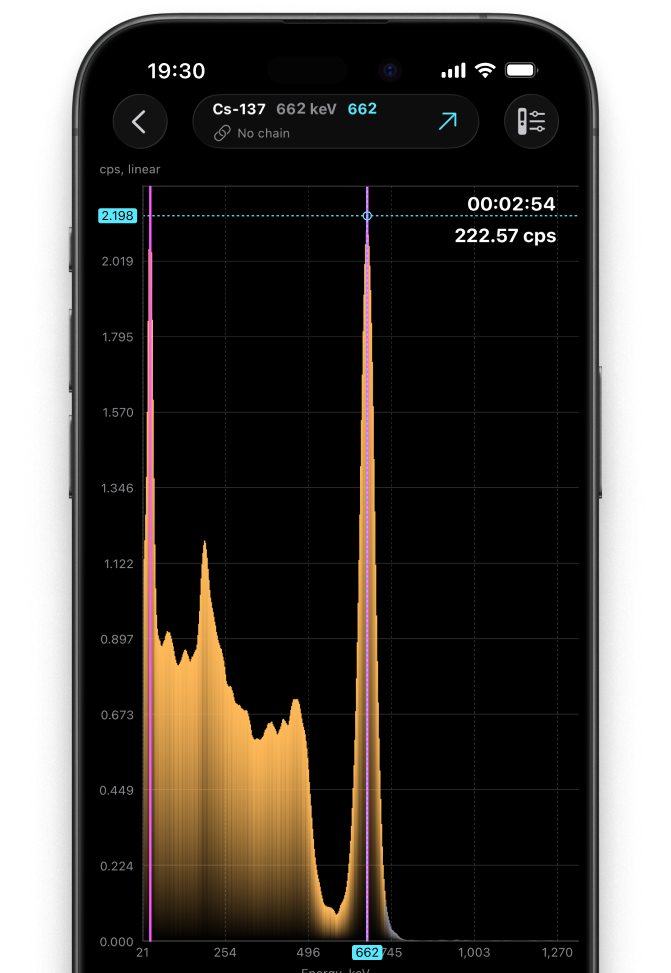
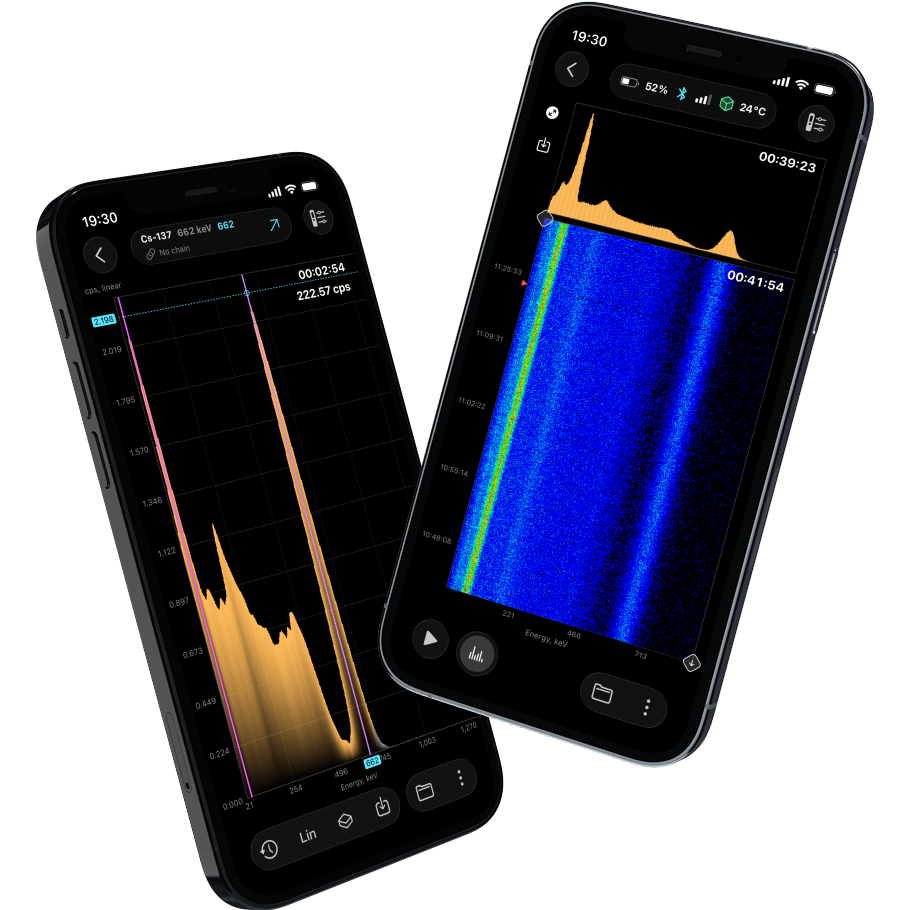
Gamma Spectroscopy
A spectrogram is a collection of gamma spectra recorded at specified time intervals, displayed as a color-coded array capable of storing thousands of spectra.
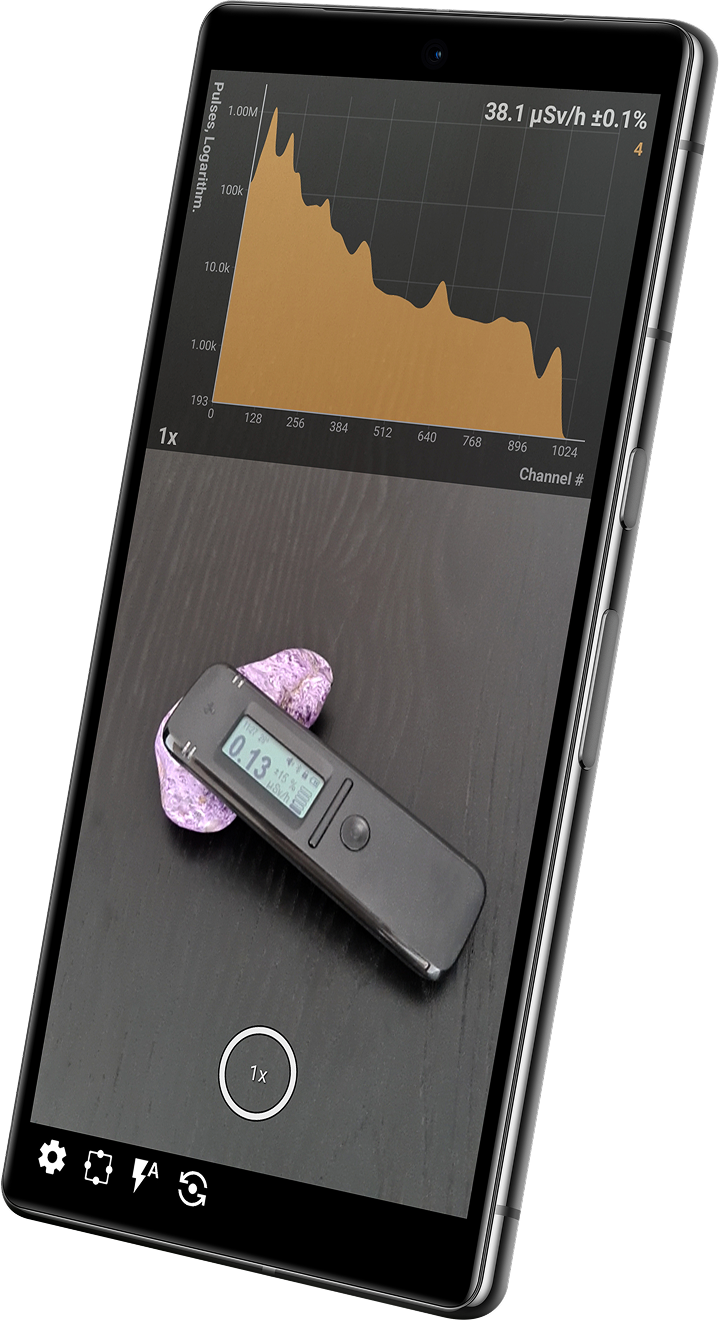
Gamma camera
The gamma camera enables prompt photo documentation of objects of interest from a radiation monitoring perspective, combined with informative elements from the application used for radiation assessment. This feature allows users to attach photos to spectra, spectrograms, and log entries, simplifying the creation of reports on identified sources of ionizing radiation.
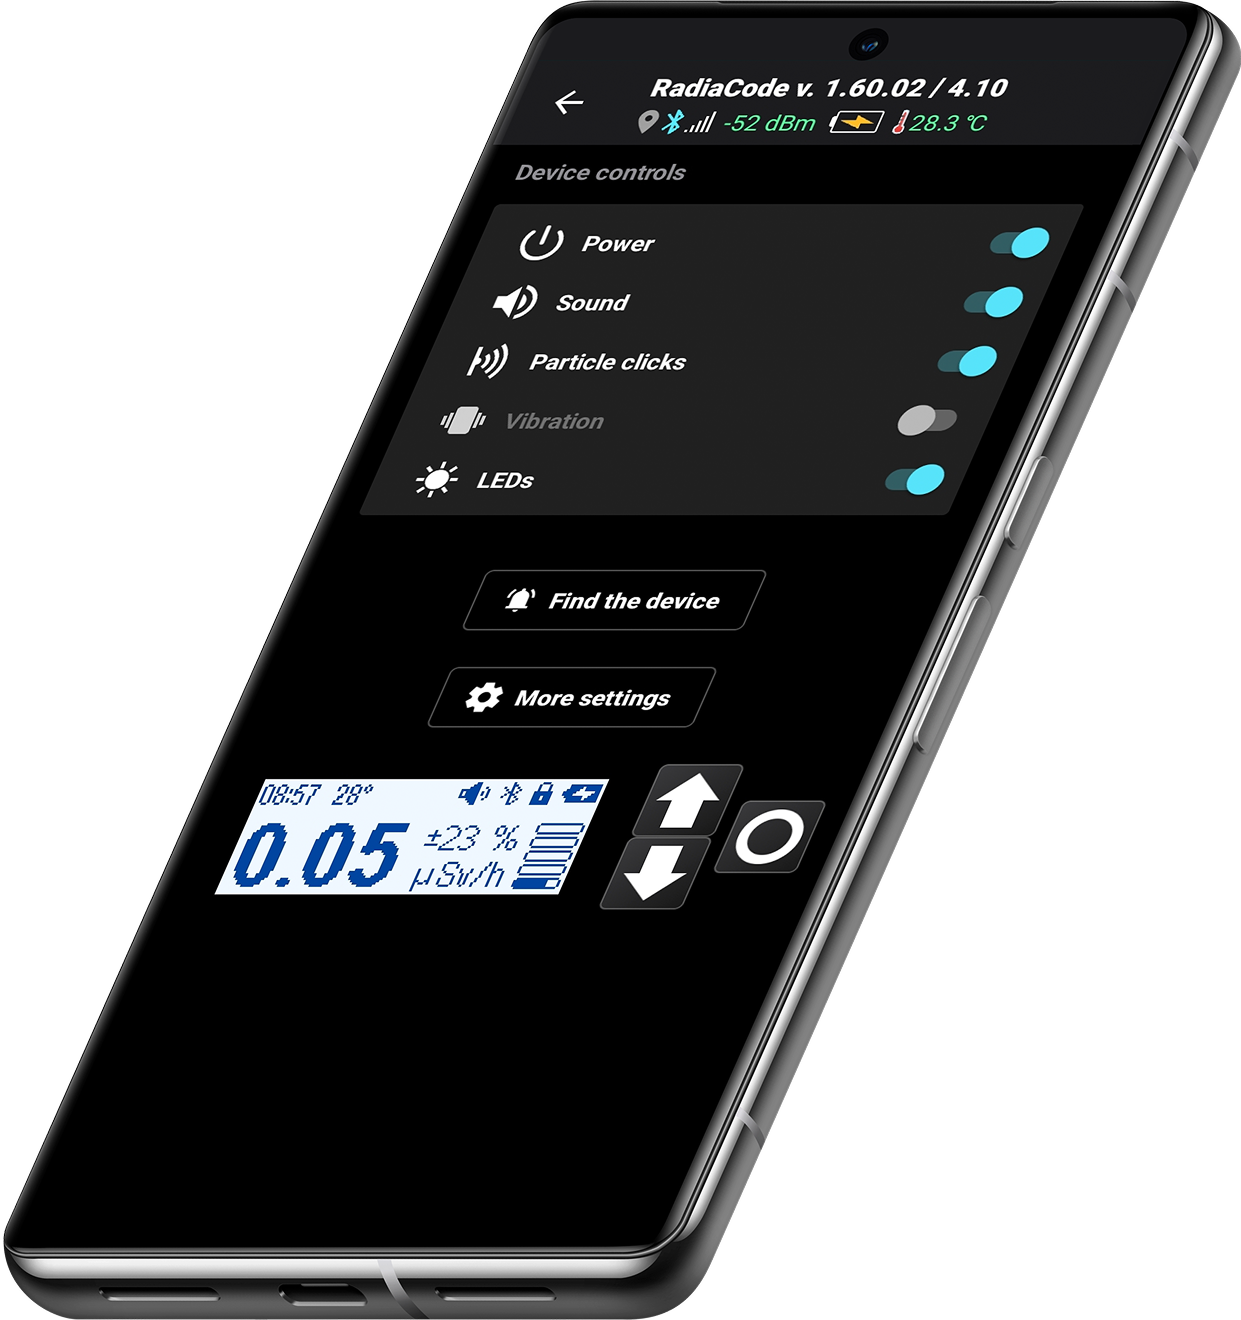
Control center
The Control Center section allows you to quickly change the most frequently used settings and manage device configurations.
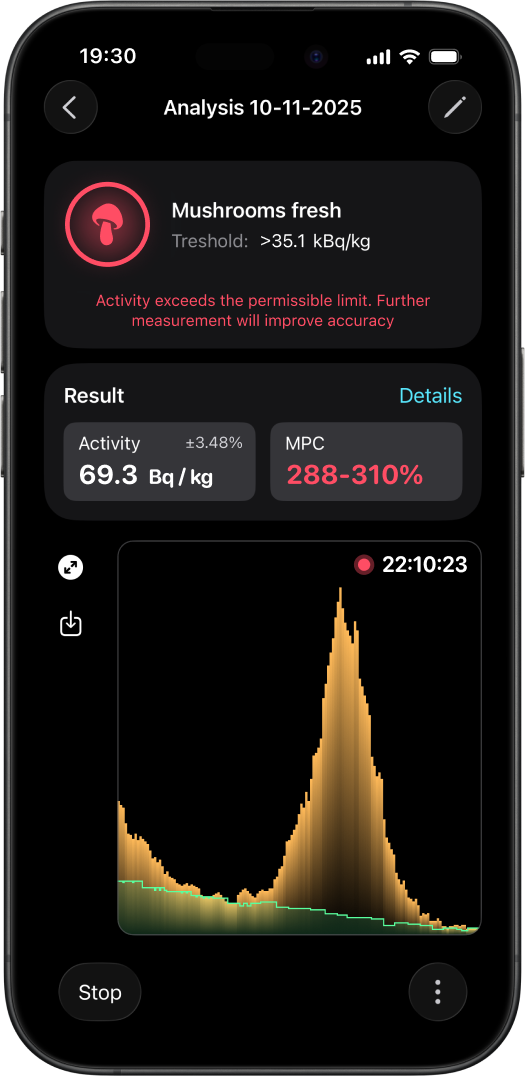
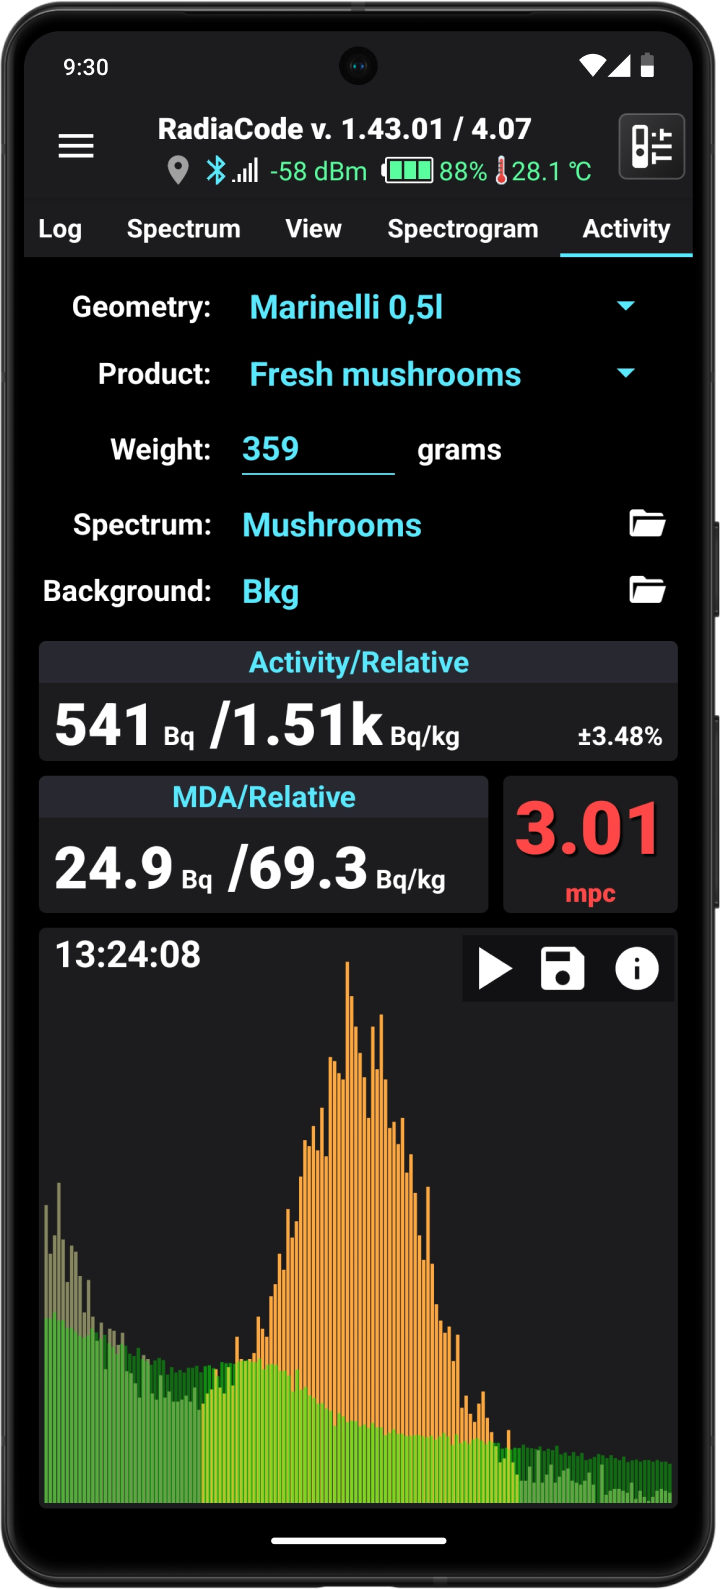
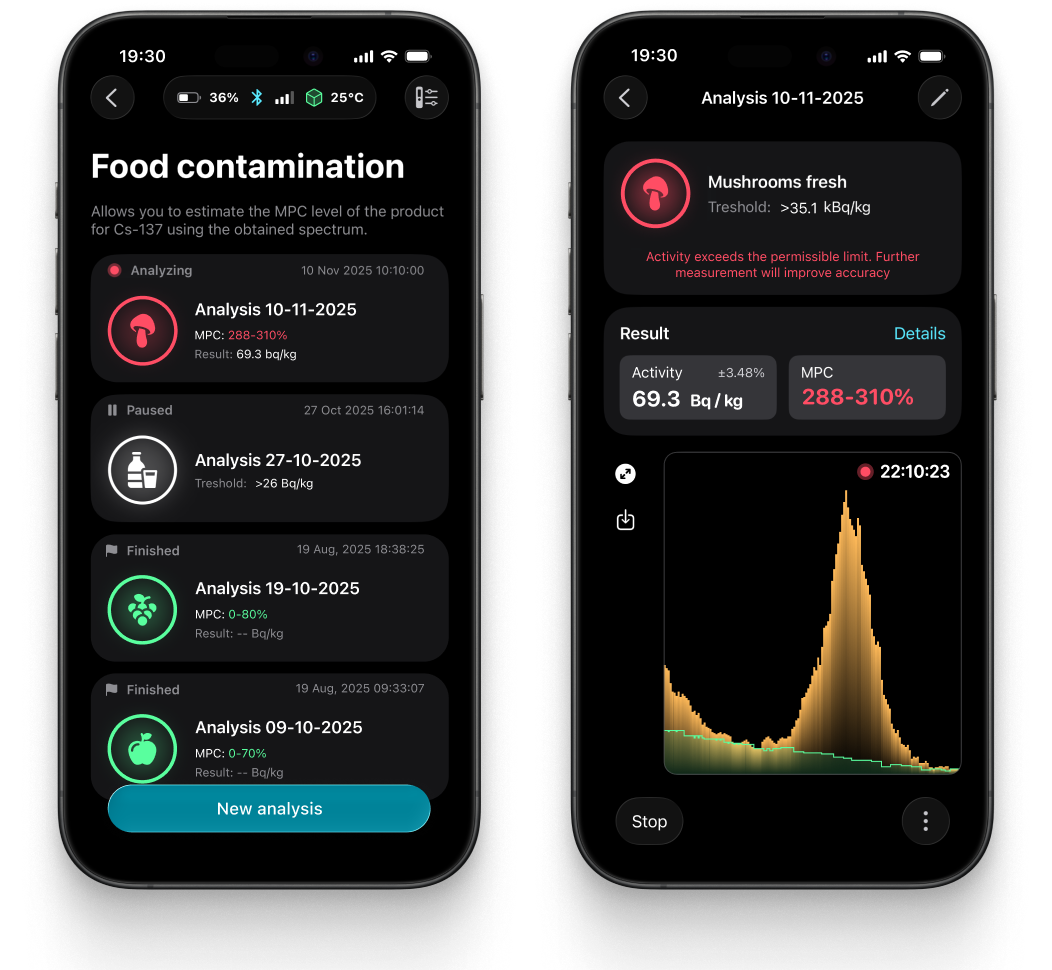
Activity monitoring
Radiacode includes a specialized mode for detecting Cesium-137 in food products. Cesium-137, a synthetic isotope produced by nuclear tests and accidents, has dispersed worldwide. It does not occur naturally and can be mistakenly absorbed by living organisms.
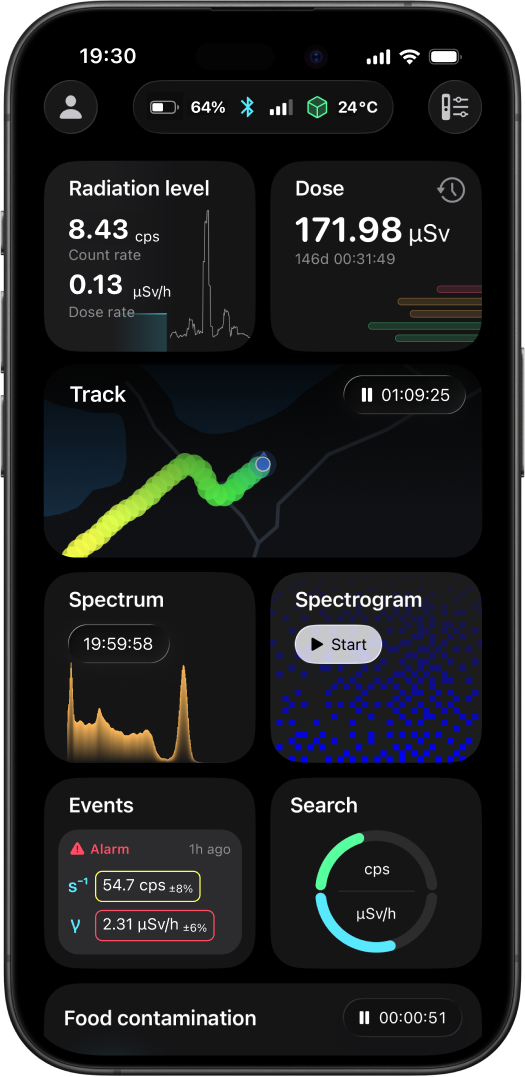
Data Visualization
The Radiacode mobile application features a real-time dashboard that consolidates key data from all sections, enabling quick monitoring of essential information at a glance. Interactive charts in a dedicated section track radiation levels over time, providing detailed analysis and insights for well-informed decision-making.
Search
This feature is specifically designed for the swift detection of radiation sources.
Events
Track all events related to the device, keeping you informed about important occurrences and changes.
Isotope visualization
The isotope visualization capability in the Radiacode mobile app enables new avenues for amateur scientific research.
Radiation mapping
The Radiation Mapping function in Radiacode records radiation measurements on Google Maps, creating a color-coded track that indicates radiation level.
Gamma Spectroscopy
A spectrogram is a collection of gamma spectra recorded at specified time intervals, displayed as a color-coded array capable of storing thousands of spectra.
Activity Monitoring
Radiacode includes a specialized mode for detecting Cesium-137 in food products. Cesium-137, a synthetic isotope produced by nuclear tests and accidents, has dispersed worldwide. It does not occur naturally and can be mistakenly absorbed by living organisms.
Remote Control
The Control Center section enables quick access to frequently used settings and allows efficient management of device configurations.
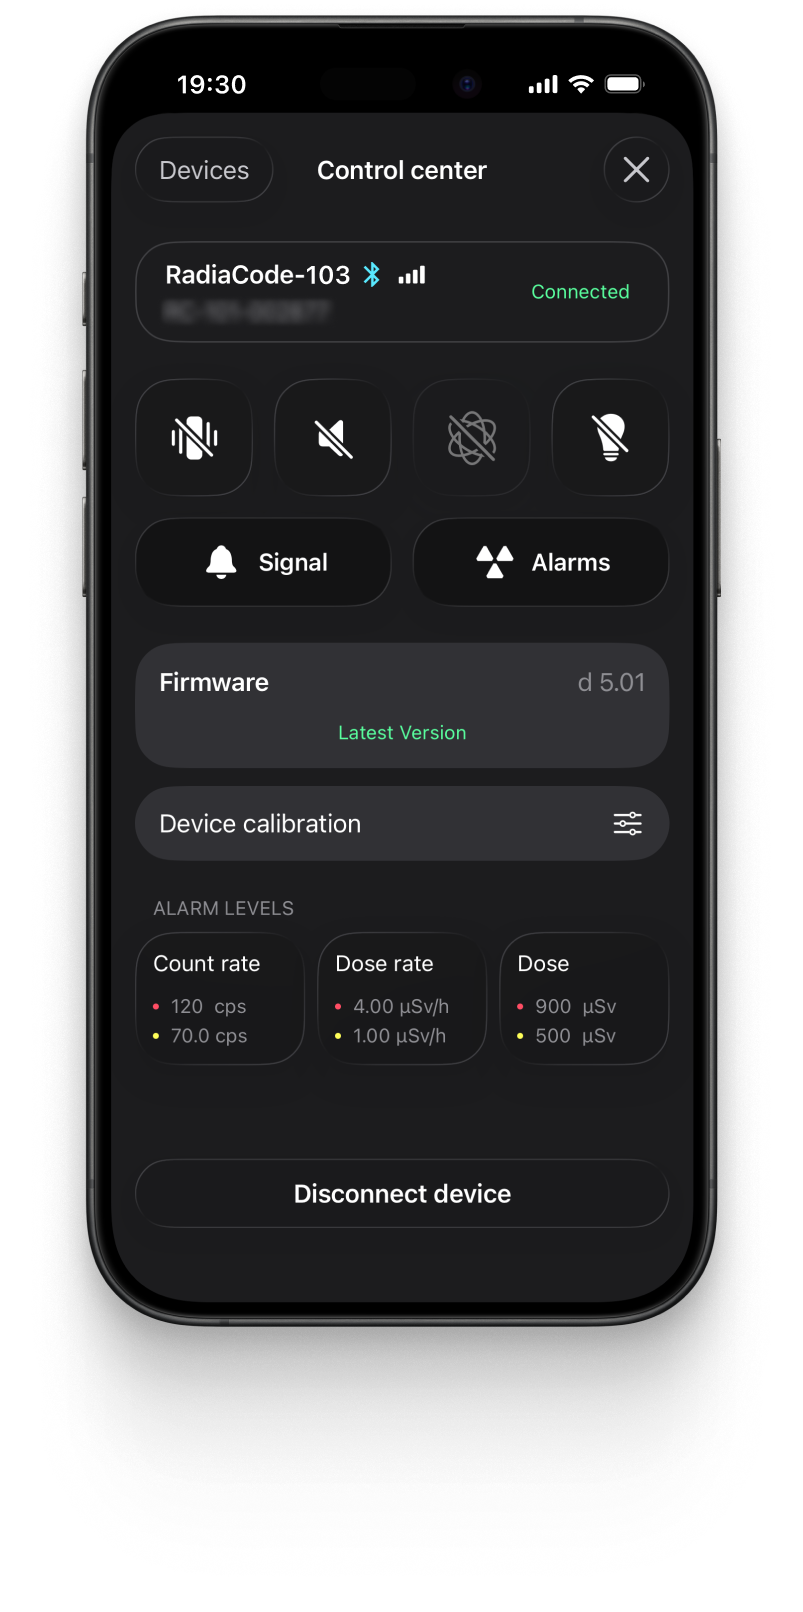
Software Upgrades
Stay up to date with the latest releases and seamlessly download updates directly to your device.
Library
Save your research tracks and spectrums, in dedicated libraries within our mobile application, ensuring easy organization and access to scientific data anytime, anywhere.