Spectrum Histogram
The "Spectrum Histogram" menu command in the "Spectrogram" tab opens a panel displaying the spectrum corresponding to the selected interval in the spectrogram:
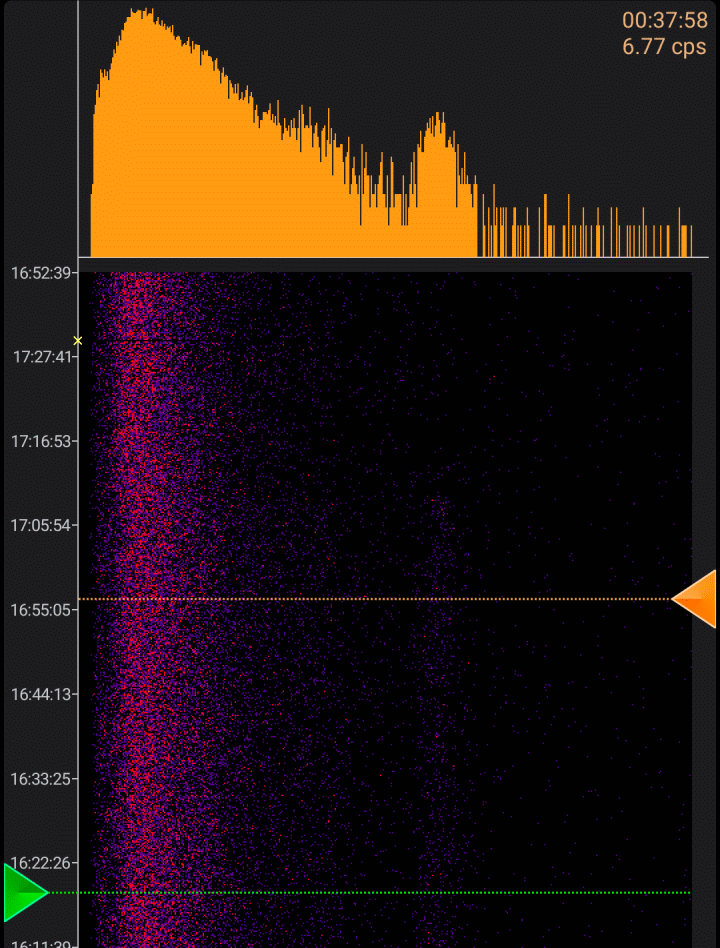
Select the interval by dragging the triangles (markers). The spectrum's scale (linear or logarithmic) matches the scale chosen for the spectrogram.
If the marker's position is outside the spectrogram area displayed on the screen, the marker's background will become semi-transparent.
A long press on the marker sets its position to the corresponding extreme value. For instance, if you perform a long press on both markers, the spectrum will be displayed for the entire spectrogram.
If, during the recording of the spectrogram, the corresponding marker is set to the extreme value, which represents the most recent data, then as new data arrives from the device, the marker will automatically move to the new extreme position, effectively "sticking" to the boundary. The behavior of the second marker in this situation depends on the setting "Do not shift the initial boundary of the spectrum histogram range in the automatic end boundary shift mode." If this setting is enabled (default), the second marker remains in place, and the spectrum interval increases as new data is received from the device. If this setting is disabled, the second marker moves to maintain a constant interval between the markers, displaying the spectrum over the selected fixed interval.
Updated: Jan 9, 2026