Current value graphs
The pulse count rate and dose rate graphs are displayed in this window. The data for the display is sourced from the database and supplemented with real-time data from the device. The Y-axis scale of the display is logarithmic.
At the top of the window, information about the accumulated radiation dose and the time of its accumulation is displayed, along with the device temperature.
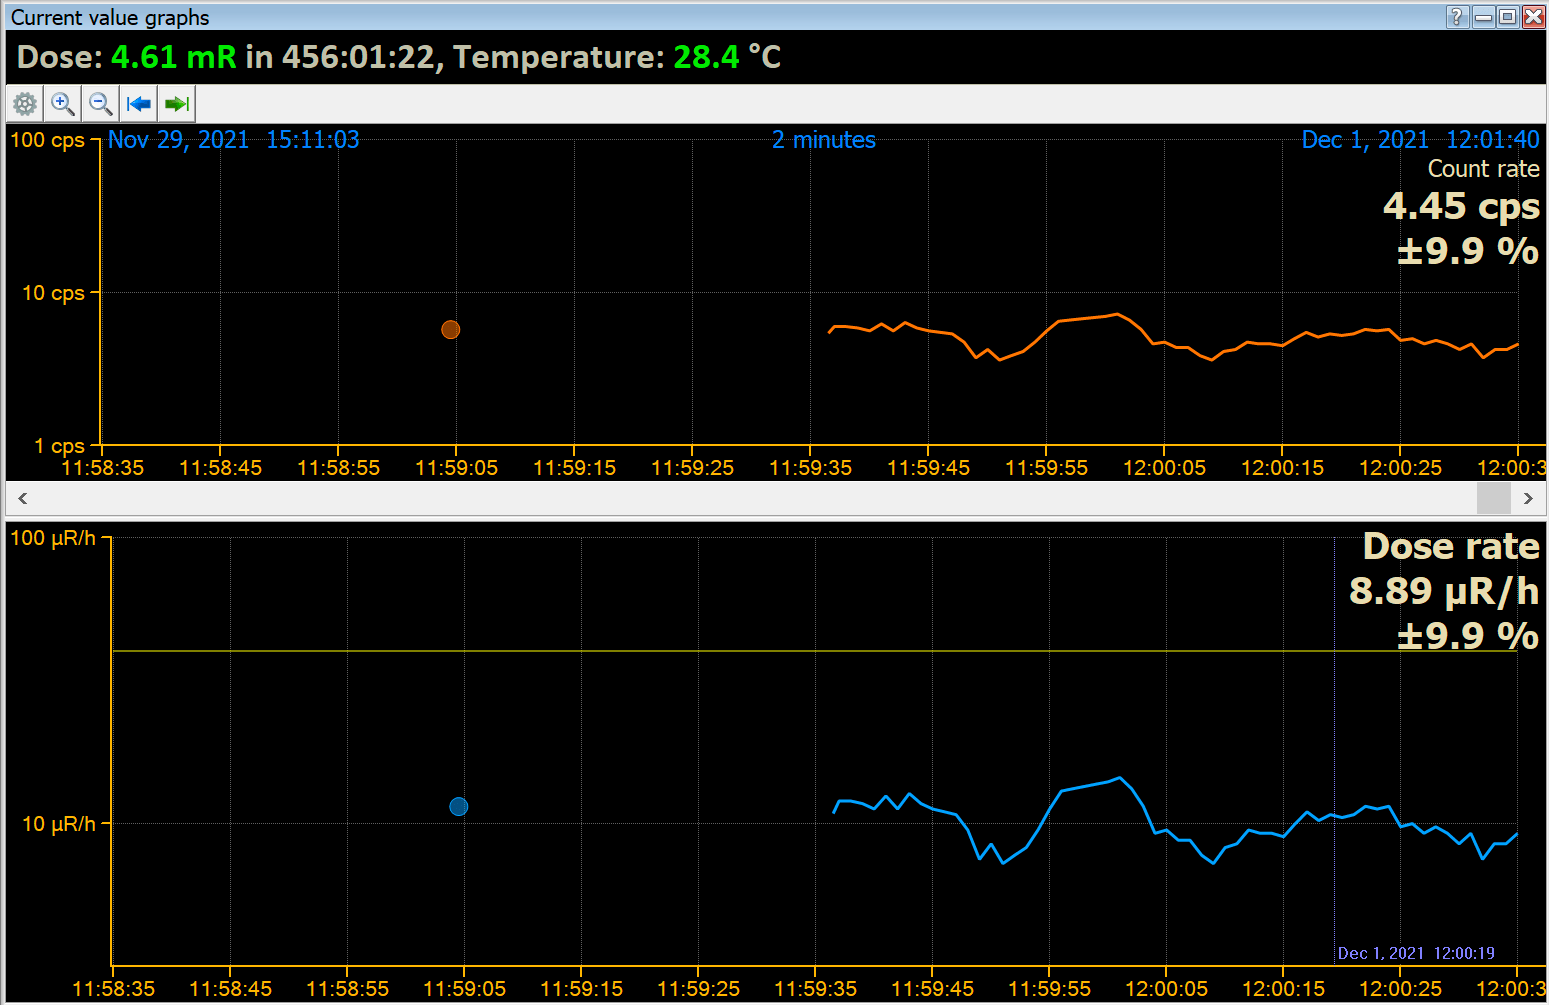
At the top of the graph, the start and end date/time of the data section loaded into the application's memory from the database are displayed in blue. This data is available for display on graphs. In the middle at the top, the time scale is shown, which in the picture is 1 minute. This means the graph displays data for 1 minute. You can change the scale using the magnifying glass icons on the window control bar.
In the program settings, you can specify whether the program should always connect the points on the graph with a line. You can set the time interval so that points on the graph, which are spaced apart in time by a value greater than the interval, will not be connected by a line but will be displayed with breaks. In the picture to the left, there are two circles representing two individual measurements.
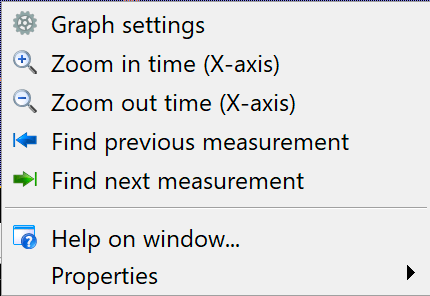
The buttons on the window's control bar replicate the commands of the local right-click menu:
| Menu item | Description |
|---|---|
Graph settings | Opens the graph settings dialog box. |
Zoom in on the time (X-axis) | Stretch the image horizontally. |
Zoom out duration (X-axis) | Reduce the image width. |
Locate the previous measurement Locate the next measurement | Search for the previous or next piece of data after a time gap. If the “Always connect graph points with a line” option is selected in the graph settings, these commands simply move backward or forward on one page. If the option to connect the points with a line is selected and they are separated by no more than the specified interval, there may be gaps in the data on the graph, and these commands move the graph to the previous or next data section. |
"Current Value Graph Settings" Dialog Box
In this dialog box, you can set the options for displaying the graph window of current values.
| Dialog Item | Description |
|---|---|
Connect the points on the graph with a line |
|
Graph line thickness | You can choose from three different values for the thickness of the graph line. |
Graph colors | Click the black button with the horizontal color line to choose the color of the corresponding graph. |
Updated: Jan 9, 2026