Dose Settings
To access the dose settings, click the  button on the "Dose" tab and choose "Settings" from the drop-down menu.
Choose devices: If the database contains records from multiple Radiacode devices, you can specify which ones to use for dose-related calculations. You can delete records of unnecessary devices through the local menu of the "Log" tab.
Main device: If the database contains records from multiple Radiacode devices, you can designate which device's data is considered the primary one. When constructing internal tables, the application uses data from the main device and only from those devices that:
- are selected in the "Choose devices" list;
- do not coincide in time with the main device's data.
Alarm values for the country: Use the drop-down list to select a country whose radiation safety standards the app uses to indicate dose alarms. The alarm color scale may appear as follows
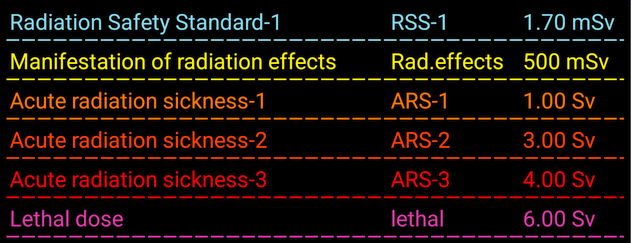
To determine the colors of the dose values displayed on the "Dose" tab, the intervals corresponding to the values are converted to a one-year period, after which the color of the value is determined using this table. For example, if 100 mR are accumulated in a month, then over a year, this will be 1.2 R, which corresponds to the Radiation Safety Standard-3. Such calculations are not always accurate, as the effect of radiation on the body also depends on the duration of exposure, among other factors.
When determining the dose alarm threshold, the value corresponding to the average background level (see below) for the year is added to the value in the table. The exception is for device alarms, where the background level is not added to their values.
Show device alarms:If the device is connected to the application and the dose alarm thresholds in the device settings are set to reasonable values, it is assumed that the device alarm thresholds are configured for a 1-year interval, and the device alarm values are added to the values in the table.
"Color scale" button: Displays the alarm threshold scale.
Forecast interval: If "Automatic" is selected, the program calculates the forecast interval. In manual mode, you can select the forecast interval from the drop-down list.
Average background level: The slider allows you to select a background level from 0 to 30 R/h (0 - 0.3 μSv/h), which determines how the columns on the dose histogram are displayed. If the reading value exceeds the average background level, the bar will point upwards; if it is lower, the bar will point downwards. This feature helps visually highlight significant readings. The average background level is also used to calculate alarm thresholds (see above).
Zero threshold for dose: Use the slider to select a dose value from 0 to 10 μR (0 - 0.1 μSv/h). When displaying the dose histogram, values below the specified threshold will be shown as zero. This prevents the display of values with insignificant levels (background or incorrectly interpolated).
Show charts: You can select which graphs to display in the "Dose" tab.
Interval dose charts: The interval dose panel can display two graphs superimposed on each other: a histogram and a regular graph. The regular graph is essentially the same histogram, presented differently and excluding the dose value corresponding to zero. You can customize the appearance of the regular graph.
Accumulated dose chart: Choose between linear, logarithmic, and quadratic scales. You can also switch the scale by double-tapping the corresponding graph.
Labels on graphs:You can choose whether the names of the units of measurement and the scale will be located on the right or left side of the graph.
Updated: Jan 9, 2026