Event Log
This page presents current and past measurement data in a table. As new significant data becomes available, it is added to the log.
Above the table, there are icons for filtering types of measurements and events, as well as the current number of displayed records.
| Icon | Description |
|---|---|
| Measurements taken by the device in automatic mode. |
| Device events include power on/off, dose accumulation reset, battery discharge, and more. |
| Current device parameters include temperature, battery charge, and more. |
| Dose Counter. This is a non-resettable dose counter, represented as an integer in microroentgens. |


The letter D in the upper right corner of the entry signifies that it was made in the application's demo mode.
Tap the gear icon at the top of the screen to open the log display settings. In these settings, you can specify:
- Which types of measurements to display;
- Which types of device events to display;
- Whether to display all records or only those where an alarm occurred;
- Choose whether to display only records with comments (a comment can be added by tapping the corresponding point on the graph of the count rate or dose rate);
- The records can be sorted by date in either descending or ascending order.
Tapping the record on the screen displays a dropdown menu:
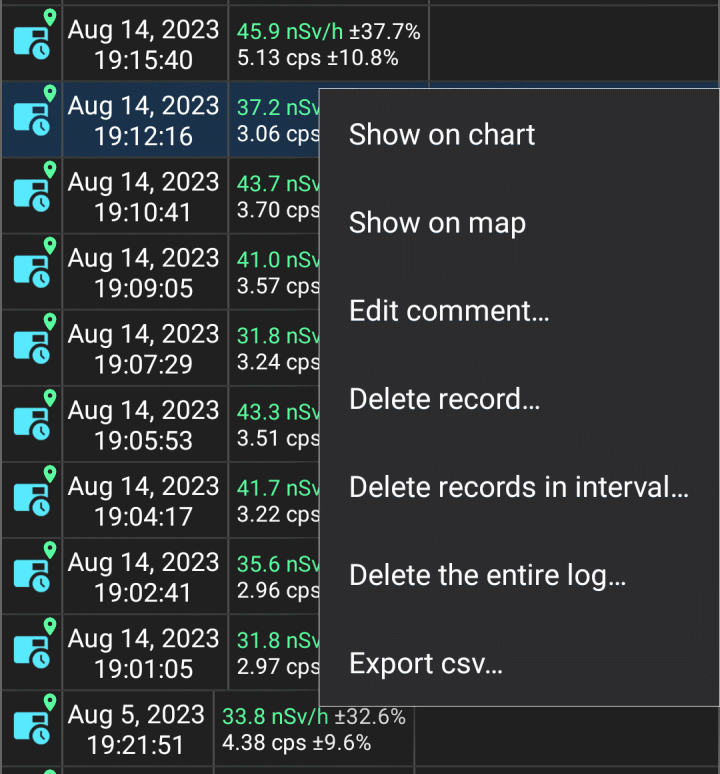
Show on chart: Display the area that corresponds to the selected record on the graph.
Show on map: If the selected record is an automatic measurement or an alarm event and contains location information, then display the pseudo tracks on the map.
Edit comment: Set a comment for the selected record. The comment text is displayed in the log in white on a blue background. Vertical white lines are drawn on graphs for records with comments if the records are of the "Automatic measurement" type.
Export csv...: Share the log file in Excel CSV text format. You will be prompted to select the time interval for exporting records and the name of the CSV file to export. Only the records that meet the conditions of the filters selected in the log settings, i.e., those that appear in the list, are exported.
Fields in a CSV file are separated by semicolons. The values in the "Time stamp" field are 64-bit decimal numbers that represent time in Windows FILETIME format, i.e., the number of 100-nanosecond intervals since January 1, 1601. The time in the "Time stamp" and "Time" fields is local. Values in the "Dose accumulation time, sec." field represent the dose accumulation time after the last reset, in seconds.
The "Delete" option opens a submenu:
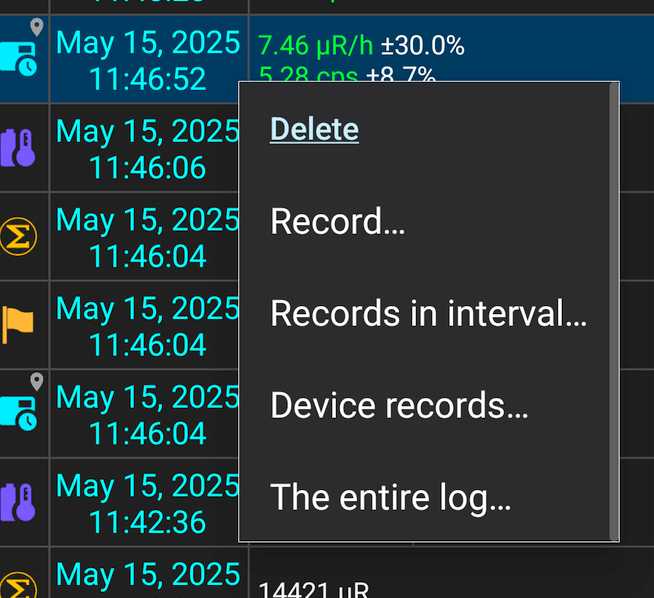
The "Record..." option deletes the record selected by tapping (it is highlighted with a blue background).
The “Records in interval...” option allows you to select a time interval for deleting records.
The "Device records..." item shows a list of device serial numbers that have records in the log. In the list, you can select devices whose records will be deleted from the log. This operation only affects the log data: spectra, spectrograms, tracks, etc., remain unchanged.
The "Entire log..." item: Once confirmed, all log records will be deleted.
The "Picture" item: A menu for managing the attached picture appears.
Updated: Jan 9, 2026