Spectrogram
This window shows the spectrogram of the recorded radiation. A spectrogram visually represents the energy spectrum of photon (gamma and X-ray) radiation as it changes over time.
This displays a plot of either the spectrogram currently being recorded or the spectrogram loaded from the Spectrogram Library. Unlike spectra, spectrograms do not have a separate viewing window.
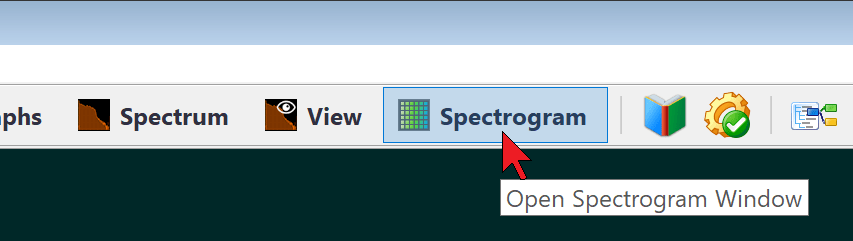
To quickly switch to the Spectrogram window, click its button on the control bar of the RadiaCode:
Each line on the vertical (Y scale) represents a separate spectrum captured in the "Capture Interval." The size of the interval can be adjusted in the settings. The horizontal (X scale) displays either spectrum channel numbers or photon energy, calculated similarly to the Spectrum window. The count rate in each individual channel (Z scale, similar to the Y scale in the Spectrum and View windows) is converted to a brightness or color scale, which can be zoomed using the sliders below the spectrogram. By pressing the button, the scale is automatically adjusted to the minimum and maximum values of the recorded or selected spectrogram from the library.
The energy lines on the spectrogram will appear as vertical bands. The emergence of new bands will indicate a change in the spectral composition of the registered radiation. The Y-axis can display calendar time, spectrogram accumulation time, or countdown number.
The total spectrogram accumulation time and capture interval are displayed at the top left.
When you hover over the graph, the marker lines with numbers corresponding to the axis values are displayed. In the image above, the energy of 654 keV corresponds to 1 pulse, and the spectrum was captured 1 minute and 44 seconds after the spectrogram recording started.
The Record button on the control bar of the window initiates spectrogram recording. Recording continues until it is stopped with the Stop button. Once stopped, the recording cannot be resumed. Loading a spectrogram from the library does not interrupt the ongoing recording; it continues in the background.
“Spectrogram Window Settings” Dialog Box
In this dialog box, you can choose various display options for the spectrogram window.
| Dialog Element | Description |
|---|---|
Spectrum Capture Interval | At what frequency are the spectrum "snapshots" (counts) taken? Each sample (spectrum) is represented on the plot by a series of horizontal squares. Acceptable values range from 1 to 600 seconds. Since the instrument's timer is not precisely synchronized with the smartphone's timer, the intervals for accumulating spectra received from the instrument may vary by ±1 second. |
Maximum Number of Samples | Spectrogram buffer capacity. If the number of counts in the recorded spectrogram reaches the specified value, the oldest count is removed before adding a new one. The maximum buffer capacity is 10,000 counts. |
Scope | The count rate limits for the engine at the bottom of the window control the brightness/palette of the plot. The squares representing counts, where the count rate value is outside the specified range, are displayed with border colors (indicating the start/end of the color scale). The minimum and maximum values of the scale can be automatically adjusted by the application if the calculated values exceed the limits |
Scale | If you select the logarithmic scale, the decimal logarithm is applied to the count rate value before calculating the brightness/color of the square. You can quickly switch the scale using the "Lin." and "Log." icons on the window's control bar. |
X-axis Units | Choose either the spectrum channel number or the energy of this channel as the units for the X-axis. |
Y-axis Units | You can choose the calendar time (calculated from the start of the spectrogram recording), the spectrogram accumulation time (in hours:minutes:seconds), or the count number (counts start from zero). |
Palette | When selecting the "Brightness" option, only grayscale is used to display the count rate on the plot. The other two options allow you to choose between color palettes. |
Draw Isotope Lines | Plot the pink energy lines of isotopes on the graph. Disabling this option does not prevent isotope information from being displayed at the top of the window. |
Isotope Library | If you select "Built-in", the Spectrum and View Spectrum windows will use the isotope library that is integrated into the RadiaCode program. If "Custom" is selected, the isotope information is taken from the specified file. |

Spectrogram Library
The Spectrogram Library can be accessed through the Spectrogram Library item in the Spectrogram window's local menu or via the Spectrogram Library command in the Tools menu of the main application window. A list of saved spectrograms will be displayed:
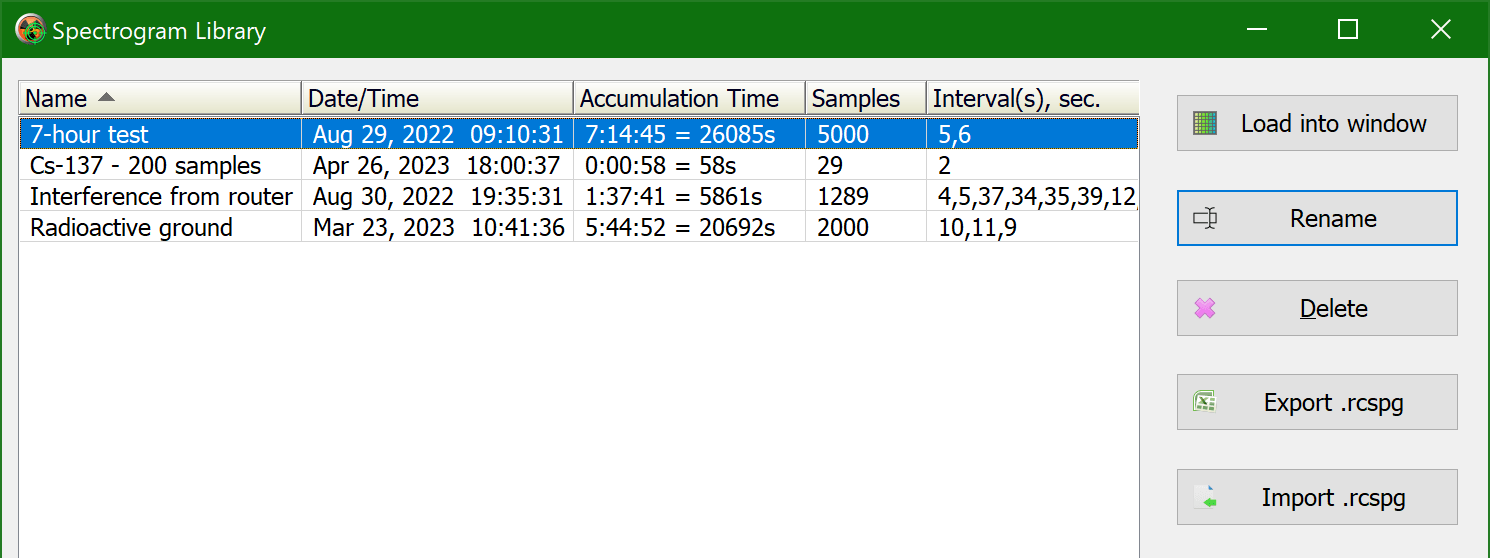
Dialog buttons execute actions on the selected spectrum or spectra in the list:
- Load into window: Load a spectrogram for viewing in the Spectrogram window. If a spectrogram is currently being recorded, it will continue in the background. To return to the graph of the recorded spectrogram, click the Close button on the control bar of the Spectrogram window.
- Rename: assign a new name to the spectrogram.
- Delete:Remove the data of a spectrogram or multiple selected spectrograms from the library.
- Export .rcspg: export spectrogram data to a text file with the .rcspg extension. .rcspg files can be exchanged between the RadiaCode applications for Windows and Android.
- Import .rcspg: import spectrogram data from a file with the .rcspg extension into the library.
Updated: Jan 9, 2026