Overview
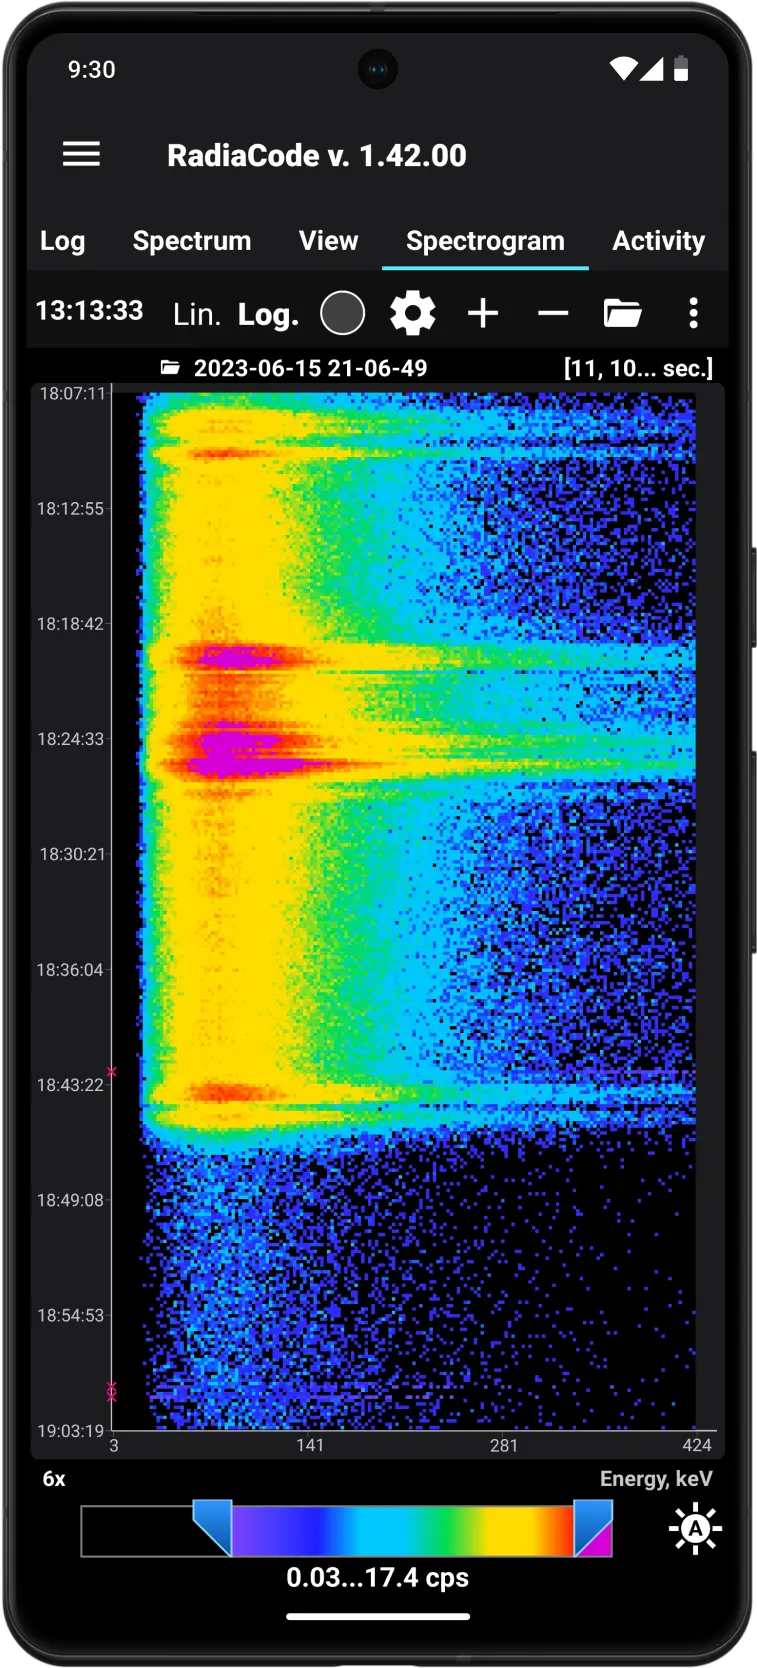
A spectrogram visually represents the energy spectrum of photon (gamma and X-ray) radiation as it changes over time.
The Spectrogram tab shows a plot of either the spectrogram currently being recorded or the one loaded from the Spectrogram Library. Unlike spectra, there is no separate tab for viewing spectrograms.
Each line on the vertical (Y scale) represents a separate spectrum captured during the "Capture Interval." The interval size can be adjusted in the settings. The horizontal (X scale) displays either spectrum channel numbers or photon energy, calculated similarly to the Spectrum tab. The count rate in each individual channel (Z scale, akin to the Y scale in the Spectrum and View tabs) is converted to a brightness or color scale, which can be zoomed using the sliders below the spectrogram. By pressing the  button, the scale is automatically adjusted to the minimum and maximum values of the recorded or selected spectrogram from the library.
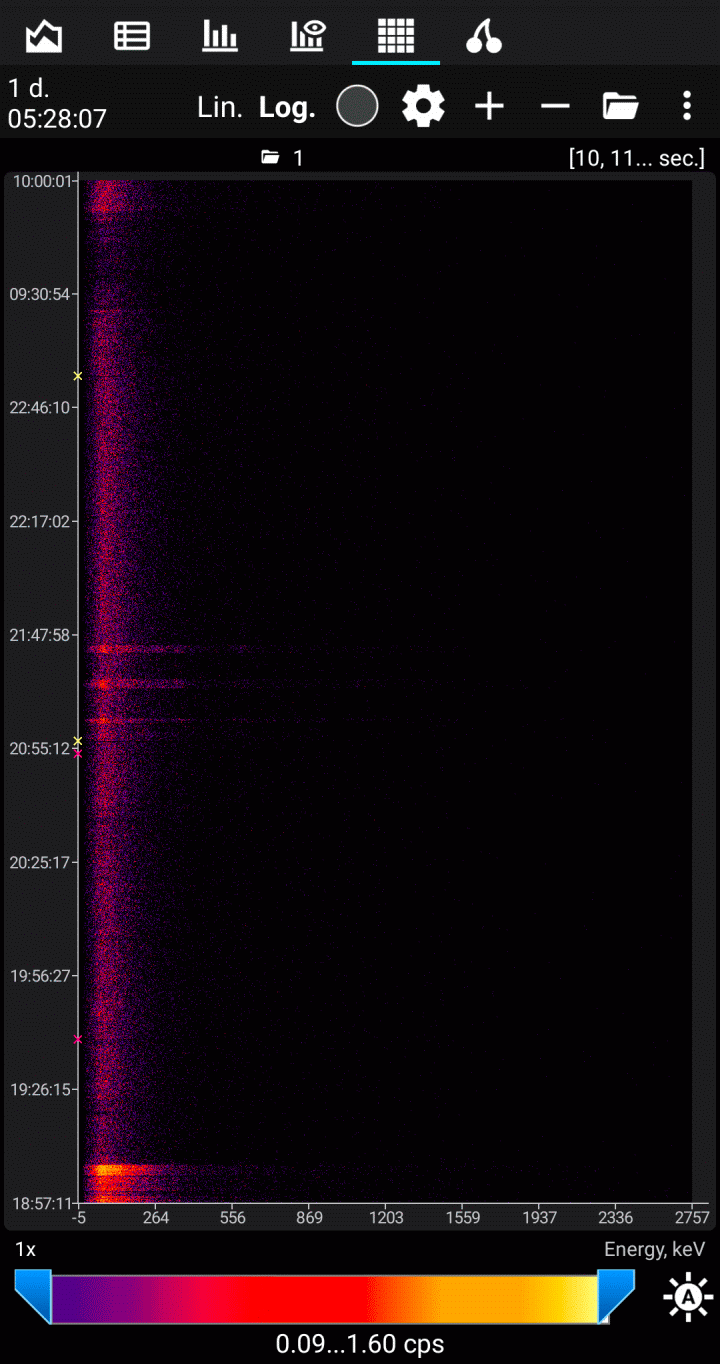
The energy lines on the spectrogram will appear as vertical bands. The emergence of new bands will indicate a change in the spectral composition of the detected radiation. The Y-axis can display calendar time, spectrogram accumulation time, or countdown number.
The total spectrogram accumulation time and capture interval are shown at the top left.
A long press on the chart reveals the marker lines and a "magnifying glass" that enlarges the section of the chart at the intersection of the marker lines:
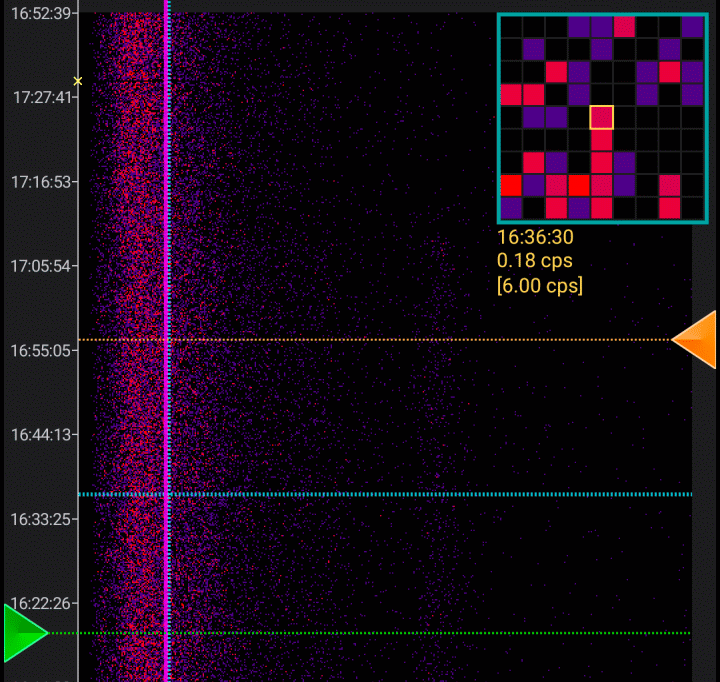
Under the magnifying glass, information about the spectrum channel at the center is displayed: its corresponding time or count number, count rate (number of pulses in this channel divided by spectrum accumulation time), and, in square brackets, the total count rate for the spectrum (sum of pulses in all channels divided by accumulation time).
| Button | Description |
|---|---|
| Start or stop the spectrogram recording. Once stopped, you can resume recording. When you exit the application, the spectrogram recording will also stop. Every minute, the recorded spectrogram is automatically saved in the library. Loading a spectrogram from the library does not stop the spectrogram recording; it continues in the background. |
| Opens the settings for the spectrogram plot. In these settings, you can choose:
|
Lin. | Choose the linear scale for converting dose rate values to brightness/color. |
Log. | Select the logarithmic scale for converting dose rate values to brightness/color. |
| Zoom in on the graph. The plot can be scrolled both horizontally and vertically. A long press on this button maximizes the zoom. You can also use gestures to zoom. |
| Zoom out. Press and hold this button to decrease the scale to one. |
| Open the spectrogram library. |
| Open the dropdown menu. The menu contains available actions:
|


Updated: Jan 9, 2026